Results
| Country: | U.S.A.
| | Station: | LISCO, NEBR. | | River: | NORTH PLATTE RIVER | | Area: | 69148.90 | | Lat: | 41.5 | | Lon: | -102.63 | | Source: | USGS | | PointID: | 6686000 | | Area Units: | km2 | | Discharge Units: | m3/sec | | Starting Year: | 1929 | | Ending Year: | 1965 | | Total Years: | 37 | | Total Usable Years: | 36 | |
| |
| Year | Jan | Feb | Mar | Apr | May | Jun | Jul | Aug | Sep | Oct | Nov | Dec | Avg Annual |
|---|
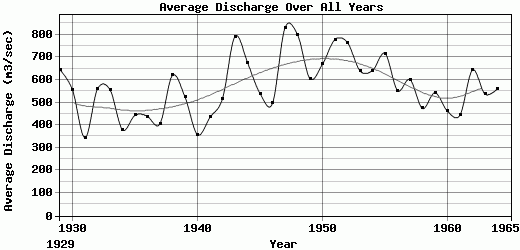
| 1929 | 255.33 | 231.42 | 806.72 | 758.33 | 1099.34 | 1954.91 | 1012.84 | 315.11 | 332.31 | 393.7 | 323.47 | 251.2 | 644.56 |
| 1930 | 309.34 | 532.36 | 599.86 | 902.18 | 832.52 | 1042.92 | 596.58 | 492.62 | 363.78 | 380 | 322.07 | 292.32 | 555.55 |
| 1931 | 205.5 | 365.49 | 355.06 | 360.29 | 504.57 | 1051.32 | 283.24 | 238 | 173.35 | 256.04 | 198.01 | 142.12 | 344.42 |
| 1932 | 185.2 | 159.39 | 299.8 | 589.94 | 1069.1 | 1957.18 | 1009.46 | 370.86 | 312.74 | 311.92 | 258.96 | 189.48 | 559.5 |
| 1933 | 216.79 | 201.15 | 703.27 | 489.03 | 962.23 | 2021.55 | 626.64 | 294.72 | 385.43 | 272.42 | 329.03 | 172.37 | 556.22 |
| 1934 | 283.02 | 471.48 | 495.57 | 545.2 | 777.71 | 778.34 | 263.73 | 152.84 | 131.83 | 232.17 | 241.8 | 180.64 | 379.53 |
| 1935 | 151.11 | 246.84 | 342.04 | 439.1 | 515.46 | 1538.84 | 950.26 | 298.41 | 208.89 | 231.34 | 202.61 | 197.58 | 443.54 |
| 1936 | 159.42 | 144.25 | 643.9 | 621.01 | 904.77 | 1188.28 | 430.67 | 274.85 | 203.45 | 239.69 | 271.45 | 175.69 | 438.12 |
| 1937 | 136.4 | 157.54 | 343.77 | 458.92 | 511.26 | 1368.66 | 845.31 | 218.71 | 177.05 | 316.68 | 208.54 | 131.08 | 406.16 |
| 1938 | 187.65 | 123.05 | 799.33 | 284.82 | 467.93 | 1625.96 | 1501.35 | 650.74 | 590.22 | 390.22 | 489.7 | 332.76 | 620.31 |
| 1939 | 297.3 | 190.85 | 921.04 | 770.51 | 935.37 | 1262.37 | 642.8 | 330.85 | 208.53 | 250.39 | 289.39 | 187.3 | 523.89 |
| 1940 | 86.15 | 135.38 | 218.21 | 451.51 | 526.06 | 857.06 | 522.59 | 521.67 | 235.75 | 352.38 | 197.78 | 186.02 | 357.55 |
| 1941 | 131.26 | 162.06 | 246.36 | 509.05 | 610.73 | 875.56 | 545.97 | 586.44 | 568.42 | 444.03 | 296.95 | 237.41 | 434.52 |
| 1942 | 158.76 | 202.26 | 502.03 | 472.42 | 683.44 | 1340.53 | 710.48 | 515.19 | 529.43 | 533.73 | 398.24 | 159.67 | 517.18 |
| 1943 | 152.83 | 437.94 | 828.23 | 986.75 | 594.57 | 1711.01 | 1373.37 | 736.79 | 762.58 | 749.12 | 648.36 | 525.23 | 792.23 |
| 1944 | 375.06 | 272.33 | 505.41 | 505.36 | 597.13 | 1999.27 | 1091.3 | 655.58 | 526.79 | 597.03 | 561.81 | 430.6 | 676.47 |
| 1945 | 454.17 | 212.18 | 515.28 | 265.58 | 383.37 | 1188.18 | 1010.37 | 516.01 | 710.47 | 690.75 | 367.27 | 166.26 | 539.99 |
| 1946 | 230.78 | 200.44 | 476.09 | 327.17 | 480.84 | 1056.32 | 737.89 | 587.99 | 715.57 | 623.25 | 281.09 | 236.58 | 496.17 |
| 1947 | 249.19 | 289.74 | 703.08 | 882.26 | 1233.71 | 1528.27 | 1252.71 | 965.61 | 897.27 | 956.93 | 602.4 | 398.26 | 829.95 |
| 1948 | 292.85 | 297.23 | 490.61 | 657.99 | 899.2 | 1868.17 | 1392.1 | 949.26 | 880.75 | 982.97 | 627.03 | 263.07 | 800.1 |
| 1949 | 301.16 | 327.67 | 534.19 | 646.95 | 789.04 | 1092.75 | 761.27 | 726.83 | 741.06 | 713.31 | 399.27 | 233.57 | 605.59 |
| 1950 | 248 | 242.21 | 387.71 | 864.42 | 605.89 | 1211.4 | 1038.78 | 826.67 | 808.83 | 855.81 | 560.96 | 383.47 | 669.51 |
| 1951 | 363.28 | 376.92 | 446.4 | 858.29 | 897.1 | 1162.7 | 945.06 | 1021.24 | 985.24 | 1049.19 | 840.92 | 392.78 | 778.26 |
| 1952 | 422.75 | 448.87 | 342.36 | 1843.81 | 1061.61 | 1172.42 | 669.47 | 830.51 | 781.27 | 780.73 | 507.25 | 312.78 | 764.49 |
| 1953 | 323.45 | 295.18 | 315.83 | 458.17 | 598.04 | 1396.41 | 792.69 | 768.76 | 860.93 | 939.3 | 568.89 | 361.18 | 639.9 |
| 1954 | 263.99 | 423.04 | 389.95 | 663.66 | 650.38 | 738.32 | 872.8 | 984.97 | 909.83 | 950.81 | 530.94 | 315.78 | 641.21 |
| 1955 | 272.63 | 286.84 | 380.18 | 943.24 | 844.12 | 1161.75 | 1152.23 | 912.54 | 838.47 | 988.63 | 465.81 | 348.66 | 716.26 |
| 1956 | 385.29 | 338.93 | 552.55 | 494.6 | 739.35 | 1380.64 | 713.77 | 493.63 | 391.25 | 363.55 | 410.5 | 374.97 | 553.25 |
| 1957 | 341.45 | 360.43 | 507.88 | 471.19 | 725.74 | 1747.63 | 1106.01 | 394.15 | 399.27 | 408.4 | 408.8 | 340.44 | 600.95 |
| 1958 | 332.04 | 336.87 | 429.5 | 485.26 | 614.84 | 979.39 | 568.9 | 411.51 | 387.47 | 407.31 | 392.85 | 339.2 | 473.76 |
| 1959 | 325.45 | 321.2 | 903.13 | 499.04 | 508.98 | 1176.01 | 770.31 | 367.94 | 370.29 | 472.62 | 390.21 | 413.25 | 543.2 |
| 1960 | 332.39 | 419.48 | 973.65 | 570.87 | 447.59 | 767.67 | 386.64 | 335.33 | 308.65 | 350.58 | 357.08 | 285.23 | 461.26 |
| 1961 | 330.7 | 331.21 | 406.03 | 316.04 | 365.72 | 861.59 | 492.99 | 261.72 | 495.98 | 616.58 | 496.77 | 356.61 | 444.33 |
| 1962 | 474.26 | 629.45 | 668.56 | 694.24 | 714.59 | 1511.28 | 1089.29 | 464.4 | 368.69 | 364.38 | 364.35 | 378.32 | 643.48 |
| 1963 | 284.13 | 586.16 | 554.37 | 333.19 | 652.11 | 1663.06 | 728.93 | 263.52 | 340.6 | 338.8 | 343.77 | 358.26 | 537.24 |
| 1964 | 467.96 | 415.48 | 295.32 | 390.63 | 717.24 | 1473.52 | 1062.25 | 396.35 | 425.7 | 374.42 | 327.72 | 382.8 | 560.78 |
| 1965 | -9999 | -9999 | -9999 | -9999 | -9999 | -9999 | -9999 | -9999 | -9999 | -9999 | -9999 | -9999 | -9999 |
| |
|
|
|
|
|
|
|
|
|
|
|
|
|
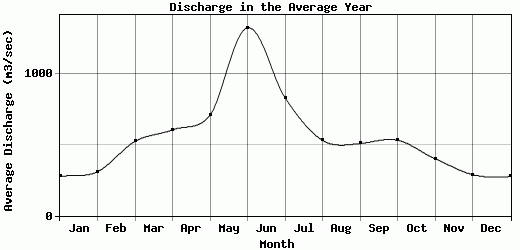
| Avg | 277.42 | 310.37 | 524.54 | 605.86 | 708.93 | 1325.31 | 831.97 | 531.45 | 509.12 | 532.75 | 402.28 | 289.8 | 570.82 |
| |
|
|
|
|
|
|
|
|
|
|
|
|
|
| Std Dev | 97.59 |
126.42 |
196.78 |
284.87 |
212.23 |
367.42 |
303.99 |
246.56 |
250.55 |
256.28 |
145.78 |
97.16 |
127.05 |
| |
|
|
|
|
|
|
|
|
|
|
|
|
|
| | Jan | Feb | Mar | Apr | May | Jun | Jul | Aug | Sep | Oct | Nov | Dec | Avg Annual |
Click here for this table in tab-delimited format.
Tab-delimited format will open in most table browsing software, i.e. Excel, etc.
View this station on the map.
Return to start.