Results
| Country: | U.S.A.
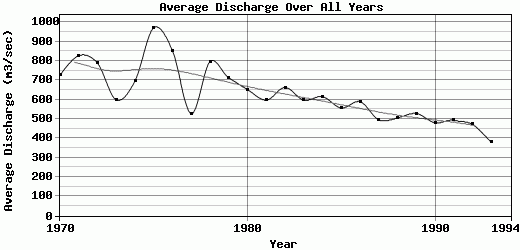
| | Station: | NORTH PLATTE, NEBR. | | River: | NORTH PLATTE RIVER | | Area: | 80026.26 | | Lat: | 41.15 | | Lon: | -100.75 | | Source: | USGS | | PointID: | 6693000 | | Area Units: | km2 | | Discharge Units: | m3/sec | | Starting Year: | 1970 | | Ending Year: | 1994 | | Total Years: | 25 | | Total Usable Years: | 24 | |
| |
| Year | Jan | Feb | Mar | Apr | May | Jun | Jul | Aug | Sep | Oct | Nov | Dec | Avg Annual |
|---|
| 1970 | 744.01 | 792.17 | 567.8 | 707.08 | 785.48 | 781.55 | 741.63 | 759.17 | 615.14 | 748.66 | 787.4 | 678.6 | 725.72 |
| 1971 | 858.01 | 811.28 | 794.79 | 983.17 | 1076.41 | 985.62 | 982.6 | 742 | 659.69 | 660.24 | 703.39 | 675.59 | 827.73 |
| 1972 | 812.33 | 815.43 | 756.98 | 1061.98 | 1090.02 | 1053.58 | 758.99 | 650.19 | 577.95 | 600.87 | 630.9 | 645.08 | 787.86 |
| 1973 | 757.53 | 710.25 | 713.22 | 568.51 | 477.37 | 525.28 | 564.06 | 583.88 | 548.59 | 532.91 | 557.75 | 645.26 | 598.72 |
| 1974 | 738.89 | 754.95 | 710.67 | 542.65 | 590.73 | 668.19 | 731.58 | 773.78 | 655.73 | 804.57 | 688.1 | 690.93 | 695.9 |
| 1975 | 625.17 | 804.4 | 704.45 | 495.64 | 902.31 | 1136.17 | 1749.99 | 1532.68 | 1054.34 | 918.29 | 934.84 | 790.04 | 970.69 |
| 1976 | 735.79 | 891.89 | 739.8 | 901.52 | 1012.2 | 1061.32 | 1033.3 | 884.59 | 735.2 | 712.4 | 837.9 | 674.4 | 851.69 |
| 1977 | 830.14 | 791.56 | 577.48 | 455.24 | 446.95 | 437.78 | 492.44 | 459.92 | 412.01 | 356.43 | 462.42 | 597.85 | 526.69 |
| 1978 | 777.99 | 822.81 | 563.14 | 490.45 | 448.6 | 870.56 | 1089.2 | 1080.34 | 919.45 | 897.47 | 941.26 | 655.68 | 796.41 |
| 1979 | 863.76 | 861.44 | 772.69 | 785.04 | 1034.94 | 1030.17 | 735.6 | 595.84 | 493.28 | 426.76 | 398.7 | 549.9 | 712.34 |
| 1980 | 635.49 | 821 | 750.95 | 564.74 | 521.22 | 587.67 | 738.25 | 669.01 | 614.57 | 628.09 | 686.5 | 601.23 | 651.56 |
| 1981 | 708.84 | 782.26 | 633.48 | 466.29 | 493.17 | 709.72 | 797.9 | 645.17 | 544.44 | 423.48 | 427.78 | 535.47 | 597.33 |
| 1982 | 734.14 | 887.94 | 743.46 | 484.6 | 682.81 | 645.06 | 714.41 | 570.91 | 495.74 | 522.86 | 835.07 | 631.01 | 662.33 |
| 1983 | 570.27 | 834.74 | 798.72 | 623.63 | 471.98 | 507.35 | 497.19 | 742 | 642.42 | 385.48 | 469.02 | 617.13 | 596.66 |
| 1984 | 761 | 753.62 | 527.24 | 454.39 | 386.57 | 395.4 | 621.79 | 770.04 | 724.73 | 662.34 | 714.72 | 612.38 | 615.35 |
| 1985 | 757.34 | 816.44 | 539.3 | 495.74 | 524.32 | 566.15 | 547.34 | 514.27 | 479.6 | 382.19 | 439.39 | 616.03 | 556.51 |
| 1986 | 734.6 | 741.4 | 711.67 | 542.46 | 298.97 | 423.34 | 537.47 | 674.95 | 546.52 | 613.57 | 677.44 | 565.15 | 588.96 |
| 1987 | 668.46 | 764.46 | 471.25 | 299.88 | 433.8 | 508.76 | 519.3 | 515 | 461.1 | 369.31 | 364.35 | 568.26 | 495.33 |
| 1988 | 604.52 | 739.56 | 548.16 | 518.2 | 527.79 | 540.67 | 542.04 | 510.8 | 388.51 | 304.27 | 315.83 | 519.21 | 504.96 |
| 1989 | 540.76 | 637.13 | 457.46 | 447.22 | 586.16 | 634.49 | 634.76 | 618.04 | 366.52 | 310.76 | 538.4 | 563.97 | 527.97 |
| 1990 | 685.91 | 548.34 | 427.13 | 500.36 | 543.23 | 571.53 | 557.84 | 514.27 | 311.3 | 283.63 | 324.8 | 488.61 | 479.75 |
| 1991 | 582.6 | 596.48 | 353.05 | 491.96 | 550.26 | 543.88 | 546.43 | 546.06 | 389.45 | 373.24 | 401.06 | 535.19 | 492.47 |
| 1992 | 632.84 | 577.47 | 356.7 | 464.78 | 545.88 | 550.11 | 545.06 | 513.27 | 384.26 | 282.03 | 286.19 | 516.28 | 471.24 |
| 1993 | 533.55 | 389.36 | 293.67 | 291 | 431.61 | 444.2 | 418.27 | 447.23 | 319.79 | 281.62 | 310.26 | 383.83 | 378.7 |
| 1994 | -9999 | -9999 | -9999 | -9999 | -9999 | -9999 | -9999 | -9999 | -9999 | -9999 | -9999 | -9999 | -9999 |
| |
|
|
|
|
|
|
|
|
|
|
|
|
|
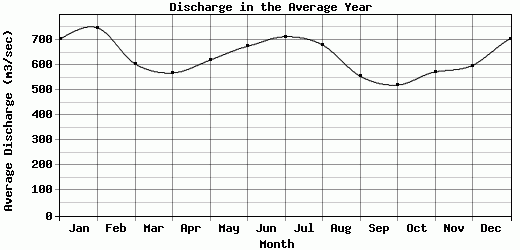
| Avg | 703.91 | 747.77 | 604.72 | 568.19 | 619.28 | 674.11 | 712.39 | 679.73 | 555.85 | 520.06 | 572.23 | 598.21 | 629.7 |
| |
|
|
|
|
|
|
|
|
|
|
|
|
|
| Std Dev | 94.16 |
116.86 |
149.89 |
187.59 |
228.88 |
222.81 |
275.95 |
228.54 |
177.59 |
196.24 |
201.53 |
81.05 |
140.52 |
| |
|
|
|
|
|
|
|
|
|
|
|
|
|
| | Jan | Feb | Mar | Apr | May | Jun | Jul | Aug | Sep | Oct | Nov | Dec | Avg Annual |
Click here for this table in tab-delimited format.
Tab-delimited format will open in most table browsing software, i.e. Excel, etc.
View this station on the map.
Return to start.