Results
| Country: | U.S.A.
| | Station: | SUTHERLAND NEBR | | River: | NORTH PLATTE R | | Area: | 77177.43 | | Lat: | 41.21 | | Lon: | -101.11 | | Source: | USGS | | PointID: | 6691000 | | Area Units: | km2 | | Discharge Units: | m3/sec | | Starting Year: | 1949 | | Ending Year: | 1969 | | Total Years: | 21 | | Total Usable Years: | 20 | |
| |
| Year | Jan | Feb | Mar | Apr | May | Jun | Jul | Aug | Sep | Oct | Nov | Dec | Avg Annual |
|---|
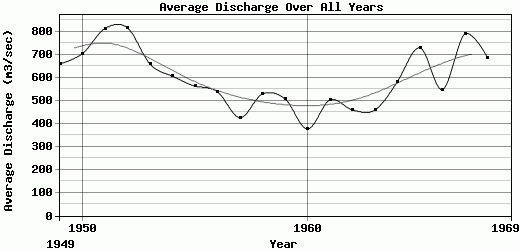
| 1949 | 331.86 | 343.34 | 629.55 | 1116.92 | 793.42 | 1098.04 | 773.69 | 729.3 | 730.67 | 727.11 | 420.04 | 216.21 | 659.18 |
| 1950 | 244.62 | 241.6 | 325.37 | 1228.77 | 670.66 | 1187.43 | 1065.54 | 824.66 | 827.89 | 876.73 | 562.56 | 384.11 | 703.33 |
| 1951 | 380.91 | 380.86 | 407.4 | 1128.15 | 893.36 | 1189.03 | 957.48 | 1035.31 | 1037.91 | 1091.21 | 913.41 | 337.52 | 812.71 |
| 1952 | 421.74 | 465.57 | 329.57 | 2404.11 | 1071.02 | 1195.07 | 681.62 | 804.39 | 787.4 | 791.51 | 535.85 | 297.8 | 815.47 |
| 1953 | 316.84 | 312.35 | 348.92 | 496.77 | 661.61 | 1453.42 | 843.48 | 778.81 | 852.53 | 949.35 | 611.93 | 273.85 | 658.32 |
| 1954 | 255.68 | 318.16 | 460.47 | 630.81 | 714.41 | 452.98 | 911.44 | 1102.35 | 1088.13 | 782.28 | 313.92 | 233.45 | 605.34 |
| 1955 | 183.36 | 209.95 | 156.47 | 404.89 | 1114.96 | 658.37 | 808.59 | 732.68 | 861.59 | 906.42 | 458.07 | 256.77 | 562.68 |
| 1956 | 215.3 | 164.14 | 256.95 | 706.13 | 808.68 | 932.48 | 845.95 | 771.32 | 575.4 | 458.46 | 398.74 | 322.46 | 538 |
| 1957 | 332.13 | 395.43 | 325.08 | 486.58 | 563.14 | 434.62 | 468.05 | 614.39 | 470.53 | 410.11 | 280.21 | 324.59 | 425.41 |
| 1958 | 416.08 | 372.27 | 408.95 | 513.67 | 576.66 | 822.7 | 374.94 | 531.37 | 835.54 | 576.84 | 483.65 | 431.97 | 528.72 |
| 1959 | 414.34 | 442.35 | 389.5 | 475.25 | 588.81 | 598.34 | 600.14 | 612.74 | 601.36 | 451.88 | 473.08 | 441.84 | 507.47 |
| 1960 | 441.75 | 510.29 | 475.45 | 348.1 | 375.11 | 244.32 | 309.93 | 364.38 | 354.81 | 281.5 | 362.23 | 448.69 | 376.38 |
| 1961 | 589.27 | 565.73 | 564.79 | 587.48 | 545.15 | 401.44 | 394.7 | 460.65 | 242 | 491.88 | 702.92 | 485.86 | 502.66 |
| 1962 | 605.25 | 655.54 | 642.98 | 645.91 | 644.07 | 585.77 | 376.24 | 261.59 | 223.33 | 230.24 | 227.48 | 409.5 | 458.99 |
| 1963 | 588.08 | 584.04 | 605.89 | 476.45 | 256.52 | 458.92 | 485.96 | 255.52 | 279.91 | 319.16 | 490.07 | 704.18 | 458.73 |
| 1964 | 733.59 | 786.82 | 705.73 | 578.04 | 485.45 | 611.08 | 396.53 | 374.61 | 543.12 | 457.02 | 660.64 | 653.57 | 582.18 |
| 1965 | 786.03 | 883.39 | 865.95 | 735.77 | 665.91 | 764.18 | 610.73 | 373.22 | 372.74 | 843.66 | 956.26 | 884.59 | 728.54 |
| 1966 | 677.6 | 868.12 | 613.93 | 266.93 | 301.44 | 323.22 | 524.05 | 558.39 | 471.95 | 600.05 | 724.25 | 641.33 | 547.61 |
| 1967 | 774.97 | 928.7 | 818.82 | 512.13 | 282.1 | 821.76 | 955.2 | 1099.52 | 808.92 | 891.53 | 802.13 | 768.21 | 788.67 |
| 1968 | 790.14 | 885.35 | 578.98 | 675.51 | 589.63 | 483.65 | 474.08 | 598.49 | 694.33 | 949.72 | 732.66 | 781.82 | 686.2 |
| 1969 | -9999 | -9999 | -9999 | -9999 | -9999 | -9999 | -9999 | -9999 | -9999 | -9999 | -9999 | -9999 | -9999 |
| |
|
|
|
|
|
|
|
|
|
|
|
|
|
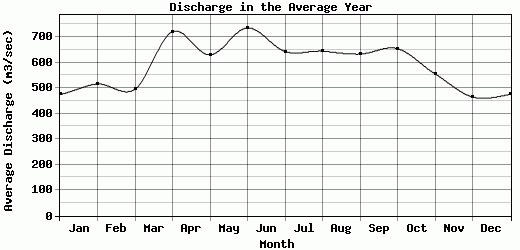
| Avg | 474.98 | 515.7 | 495.54 | 720.92 | 630.11 | 735.84 | 642.92 | 644.18 | 633 | 654.33 | 555.5 | 464.92 | 597.33 |
| |
|
|
|
|
|
|
|
|
|
|
|
|
|
| Std Dev | 197.01 |
237.73 |
183.12 |
459.62 |
228.16 |
333.05 |
229.29 |
250.74 |
252.38 |
250.52 |
199.19 |
197.97 |
126.58 |
| |
|
|
|
|
|
|
|
|
|
|
|
|
|
| | Jan | Feb | Mar | Apr | May | Jun | Jul | Aug | Sep | Oct | Nov | Dec | Avg Annual |
Click here for this table in tab-delimited format.
Tab-delimited format will open in most table browsing software, i.e. Excel, etc.
View this station on the map.
Return to start.