Results
| Country: | U.S.A.
| | Station: | SIMMONS, TEX.(DISC) | | River: | NUECES RIVER | | Area: | 22171.68 | | Lat: | 28.42 | | Lon: | -98.28 | | Source: | USGS | | PointID: | 8194600 | | Area Units: | km2 | | Discharge Units: | m3/sec | | Starting Year: | 1964 | | Ending Year: | 1993 | | Total Years: | 30 | | Total Usable Years: | 29 | |
| |
| Year | Jan | Feb | Mar | Apr | May | Jun | Jul | Aug | Sep | Oct | Nov | Dec | Avg Annual |
|---|
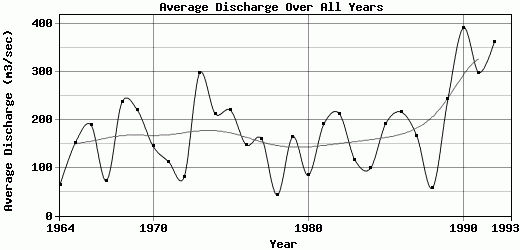
| 1964 | 14.55 | 23.33 | 44.2 | 55.5 | 29.02 | 45.01 | 10.59 | 13.09 | 50.86 | 138.46 | 142.11 | 207.11 | 64.49 |
| 1965 | 86.01 | 343.93 | 174.82 | 133.59 | 700.71 | 248.02 | 29.33 | 17.3 | 24.11 | 16.82 | 27.67 | 30.66 | 152.75 |
| 1966 | 29.26 | 101.85 | 43.54 | 270.2 | 1256.18 | 273.87 | 137.02 | 43.75 | 43.37 | 37.88 | 17.53 | 20.35 | 189.57 |
| 1967 | 20.36 | 18.97 | 20.68 | 55.86 | 44.62 | 117.62 | 43.5 | 11.7 | 68.19 | 75.24 | 252.67 | 148.33 | 73.15 |
| 1968 | 278.9 | 231.69 | 396.38 | 580.88 | 682.84 | 316.07 | 135.89 | 44.95 | 28.74 | 22.97 | 36.28 | 92.63 | 237.35 |
| 1969 | 36.29 | 207.44 | 447.08 | 493.81 | 877.62 | 315.66 | 53.69 | 18.59 | 22.86 | 26.76 | 49.68 | 89.6 | 219.92 |
| 1970 | 102.17 | 139.21 | 614.02 | 247.35 | 267.75 | 109.18 | 15.99 | 18.56 | 42.53 | 89.16 | 68.26 | 27.16 | 145.11 |
| 1971 | 23.12 | 33.28 | 47.27 | 36.38 | 26.6 | 23.27 | 16.12 | 48.52 | 19.53 | 182.06 | 190.21 | 707.13 | 112.79 |
| 1972 | 515.29 | 83.85 | 33.62 | 26.35 | 46.65 | 27.1 | 17.26 | 13.76 | 14.52 | 48.35 | 85.05 | 54.73 | 80.54 |
| 1973 | 131.54 | 188.8 | 380.95 | 361.08 | 569.82 | 642.6 | 160.86 | 85.8 | 60.45 | 476.8 | 299.26 | 215.53 | 297.79 |
| 1974 | 310.52 | 129.07 | 76.65 | 77.94 | 208.51 | 115.33 | 21.03 | 34.06 | 196.29 | 81.35 | 739.24 | 567.62 | 213.13 |
| 1975 | 225.7 | 659.99 | 249.45 | 400.04 | 383.01 | 457.56 | 107.07 | 60.46 | 24.61 | 24.16 | 21.65 | 26.24 | 220 |
| 1976 | 29.54 | 30.63 | 71.67 | 280.99 | 380.79 | 328.94 | 145.38 | 24.44 | 105.03 | 98.17 | 70.66 | 208.18 | 147.87 |
| 1977 | 85.57 | 360.79 | 227.28 | 735.01 | 234.43 | 139.78 | 21.03 | 29.61 | 25.43 | 19.41 | 25.14 | 24.88 | 160.7 |
| 1978 | 36.72 | 90.38 | 128.48 | 39.51 | 53.42 | 34.64 | 13.72 | 19.7 | 24.78 | 15.5 | 38.49 | 21.62 | 43.08 |
| 1979 | 118.8 | 98.87 | 268.13 | 331.94 | 427.28 | 359.3 | 91.39 | 73.93 | 62.33 | 26.7 | 38.19 | 83.94 | 165.07 |
| 1980 | 163.62 | 166.95 | 59.28 | 159.85 | 261.07 | 43.59 | 22.17 | 19.08 | 17.78 | 41.35 | 23.41 | 35.54 | 84.47 |
| 1981 | 27.36 | 35.16 | 56.37 | 57.72 | 131.37 | 620.49 | 161.64 | 29.66 | 49.68 | 266.16 | 560.87 | 294.07 | 190.88 |
| 1982 | 215.41 | 174.13 | 174.87 | 115.66 | 364.91 | 598.81 | 362.62 | 203.54 | 76.08 | 28.93 | 39.49 | 206.52 | 213.41 |
| 1983 | 79.8 | 336.28 | 307.12 | 113.45 | 166.94 | 114.97 | 62.36 | 56.27 | 29.94 | 43.54 | 42 | 52.08 | 117.06 |
| 1984 | 45.02 | 64.15 | 263.87 | 79.79 | 51.41 | 43.14 | 32.74 | 28.15 | 26.47 | 179.47 | 99.91 | 267.71 | 98.49 |
| 1985 | 209.44 | 172.9 | 313.36 | 217.32 | 323.12 | 147.2 | 39.61 | 24.72 | 28.35 | 172.19 | 240.09 | 423.67 | 192.66 |
| 1986 | 59.25 | 475.28 | 61.72 | 179.31 | 390.53 | 619.47 | 169.54 | 37 | 61.68 | 85.52 | 127.31 | 327.97 | 216.22 |
| 1987 | 144.77 | 195.11 | 507.24 | 136.1 | 103.74 | 494.6 | 144.67 | 26.69 | 33.36 | 22.07 | 50.22 | 139.28 | 166.49 |
| 1988 | 86.2 | 99.37 | 113.13 | 73.08 | 41.92 | 48.93 | 45.8 | 24.34 | 34.38 | 35.33 | 41.87 | 48.78 | 57.76 |
| 1989 | 72.44 | 173.47 | 119.84 | 212.53 | 720.44 | 837.43 | 425.47 | 171.52 | 80.58 | 30.72 | 39.55 | 34.18 | 243.18 |
| 1990 | 162.46 | 286.4 | 586.39 | 644.12 | 1758.39 | 624.67 | 190.45 | 144.21 | 49.32 | 76.55 | 110.02 | 78.97 | 392.66 |
| 1991 | 319.92 | 330.05 | 131.91 | 335.27 | 268.86 | 132.16 | 41.07 | 125.17 | 120.6 | 62.53 | 713.49 | 1003.66 | 298.72 |
| 1992 | 952.09 | 863.28 | 953.55 | 285.67 | 277.29 | 369.79 | 147.92 | 51.88 | 40.68 | 37.54 | 77.15 | 306.86 | 363.64 |
| 1993 | -9999 | -9999 | -9999 | -9999 | -9999 | -9999 | -9999 | -9999 | -9999 | -9999 | -9999 | -9999 | -9999 |
| |
|
|
|
|
|
|
|
|
|
|
|
|
|
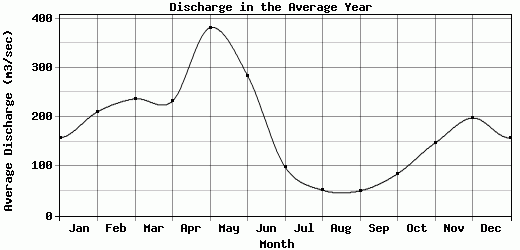
| Avg | 158 | 210.85 | 237 | 232.29 | 381.01 | 284.46 | 98.83 | 51.74 | 50.43 | 84.89 | 147.15 | 198.1 | 177.89 |
| |
|
|
|
|
|
|
|
|
|
|
|
|
|
| Std Dev | 188.22 |
190.11 |
216.56 |
187.82 |
387.38 |
232.74 |
99.26 |
48.47 |
37.53 |
95.79 |
193.81 |
226.81 |
86.61 |
| |
|
|
|
|
|
|
|
|
|
|
|
|
|
| | Jan | Feb | Mar | Apr | May | Jun | Jul | Aug | Sep | Oct | Nov | Dec | Avg Annual |
Click here for this table in tab-delimited format.
Tab-delimited format will open in most table browsing software, i.e. Excel, etc.
View this station on the map.
Return to start.