Results
| Country: | U.S.A.
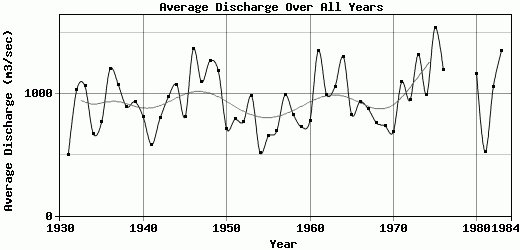
| | Station: | Claiborne,Alabama | | River: | Alabama | | Area: | 56980 km2 | | Lat: | 31.53 | | Lon: | -87.51 | | Source: | | | PointID: | 396 | | Area Units: | km2 | | Discharge Units: | m3/sec | | Starting Year: | 1930 | | Ending Year: | 1984 | | Total Years: | 55 | | Total Usable Years: | 52 | |
| |
| Year | Jan | Feb | Mar | Apr | May | Jun | Jul | Aug | Sep | Oct | Nov | Dec | Avg Annual |
|---|
| 1930 | -9999 | -9999 | -9999 | 863 | 569 | 376 | 334 | 359 | 444 | 410 | 877 | 504 | -9999 |
| 1931 | 727 | 628 | 693 | 965 | 523 | 331 | 273 | 297 | 228 | 210 | 193 | 894 | 496.83 |
| 1932 | 1509 | 2353 | 1081 | 1124 | 784 | 481 | 662 | 461 | 438 | 492 | 634 | 2324 | 1028.58 |
| 1933 | 3001 | 2086 | 2279 | 1883 | 719 | 427 | 504 | 390 | 373 | 353 | 343 | 349 | 1058.92 |
| 1934 | 533 | 445 | 1804 | 620 | 483 | 591 | 395 | 577 | 402 | 1059 | 557 | 568 | 669.5 |
| 1935 | 872 | 1047 | 2226 | 1443 | 891 | 496 | 365 | 404 | 374 | 270 | 365 | 447 | 766.67 |
| 1936 | 3165 | 3395 | 995 | 3179 | 665 | 427 | 414 | 523 | 339 | 380 | 328 | 581 | 1199.25 |
| 1937 | 2594 | 1842 | 1634 | 1464 | 1945 | 513 | 383 | 327 | 508 | 494 | 638 | 525 | 1072.25 |
| 1938 | 589 | 524 | 1386 | 4273 | 689 | 502 | 762 | 743 | 377 | 282 | 284 | 296 | 892.25 |
| 1939 | 528 | 1553 | 2106 | 1100 | 592 | 883 | 423 | 2363 | 575 | 405 | 316 | 357 | 933.42 |
| 1940 | 793 | 1659 | 1441 | 1020 | 703 | 551 | 1657 | 446 | 302 | 259 | 290 | 547 | 805.67 |
| 1941 | 829 | 743 | 1077 | 651 | 407 | 266 | 761 | 620 | 310 | 247 | 195 | 841 | 578.92 |
| 1942 | 837 | 1201 | 2174 | 1232 | 476 | 691 | 470 | 626 | 413 | 363 | 322 | 762 | 797.25 |
| 1943 | 2238 | 1207 | 2517 | 2114 | 786 | 433 | 470 | 508 | 354 | 275 | 368 | 383 | 971.08 |
| 1944 | 839 | 1370 | 2447 | 3573 | 1888 | 510 | 368 | 481 | 398 | 280 | 306 | 440 | 1075 |
| 1945 | 719 | 1518 | 1544 | 1300 | 1587 | 449 | 418 | 355 | 292 | 311 | 341 | 841 | 806.25 |
| 1946 | 3140 | 2687 | 2386 | 1981 | 1597 | 1237 | 735 | 680 | 549 | 371 | 497 | 505 | 1363.75 |
| 1947 | 2472 | 1717 | 1833 | 2197 | 1118 | 650 | 522 | 345 | 302 | 264 | 648 | 1056 | 1093.67 |
| 1948 | 667 | 2528 | 2424 | 1860 | 496 | 385 | 507 | 656 | 338 | 323 | 1302 | 3732 | 1268.17 |
| 1949 | 2391 | 2802 | 1744 | 1614 | 1698 | 730 | 950 | 584 | 525 | 332 | 435 | 435 | 1186.67 |
| 1950 | 729 | 1023 | 1465 | 773 | 685 | 464 | 667 | 673 | 848 | 393 | 362 | 464 | 712.17 |
| 1951 | 688 | 954 | 1147 | 2808 | 678 | 379 | 395 | 312 | 272 | 249 | 387 | 1189 | 788.17 |
| 1952 | 1212 | 1246 | 2433 | 1311 | 626 | 495 | 282 | 328 | 274 | 240 | 243 | 526 | 768 |
| 1953 | 1576 | 1593 | 1870 | 1387 | 1989 | 445 | 435 | 318 | 284 | 340 | 286 | 1245 | 980.67 |
| 1954 | 1270 | 960 | 985 | 947 | 473 | 339 | 219 | 222 | 199 | 173 | 192 | 225 | 517 |
| 1955 | 629 | 1132 | 858 | 2086 | 649 | 511 | 428 | 435 | 246 | 230 | 272 | 331 | 650.58 |
| 1956 | 257 | 1420 | 1921 | 1748 | 562 | 315 | 358 | 217 | 261 | 336 | 261 | 644 | 691.67 |
| 1957 | 660 | 1427 | 1035 | 2788 | 995 | 557 | 501 | 274 | 373 | 575 | 1187 | 1475 | 987.25 |
| 1958 | 923 | 1479 | 2071 | 1328 | 953 | 424 | 786 | 436 | 408 | 392 | 329 | 405 | 827.83 |
| 1959 | 704 | 1385 | 1238 | 1184 | 539 | 1098 | 338 | 277 | 318 | 489 | 529 | 607 | 725.5 |
| 1960 | 1021 | 1629 | 1865 | 1735 | 565 | 347 | 266 | 349 | 299 | 452 | 354 | 467 | 779.08 |
| 1961 | 531 | 1764 | 4675 | 2444 | 808 | 780 | 804 | 381 | 458 | 271 | 277 | 3035 | 1352.33 |
| 1962 | 2323 | 1851 | 1907 | 2505 | 573 | 409 | 379 | 275 | 292 | 378 | 486 | 511 | 990.75 |
| 1963 | 1299 | 1288 | 2004 | 3700 | 1241 | 675 | 601 | 380 | 273 | 312 | 260 | 664 | 1058.08 |
| 1964 | 1343 | 1661 | 2840 | 4091 | 1975 | 466 | 441 | 424 | 307 | 632 | 459 | 992 | 1302.58 |
| 1965 | 1298 | 2020 | 1809 | 1544 | 421 | 483 | 407 | 362 | 317 | 482 | 324 | 450 | 826.42 |
| 1966 | 738 | 2254 | 2482 | 696 | 1472 | 489 | 313 | 336 | 337 | 572 | 822 | 690 | 933.42 |
| 1967 | 1090 | 1116 | 776 | 304 | 740 | 435 | 849 | 701 | 943 | 516 | 951 | 2065 | 873.83 |
| 1968 | 2330 | 726 | 1060 | 1320 | 1000 | 402 | 363 | 404 | 232 | 234 | 338 | 691 | 758.33 |
| 1969 | 1060 | 1410 | 1140 | 1200 | 1160 | 502 | 337 | 335 | 466 | 451 | 262 | 510 | 736.08 |
| 1970 | 828 | 792 | 1760 | 1230 | 561 | 744 | 254 | 396 | 370 | 304 | 467 | 548 | 687.83 |
| 1971 | 1070 | 1970 | 3400 | 1480 | 979 | 490 | 565 | 714 | 504 | 316 | 306 | 1320 | 1092.83 |
| 1972 | 2770 | 1390 | 1930 | 760 | 736 | 467 | 508 | 375 | 377 | 220 | 409 | 1400 | 945.17 |
| 1973 | 2200 | 1540 | 2220 | 2980 | 2160 | 1600 | 669 | 434 | 345 | 338 | 426 | 922 | 1319.5 |
| 1974 | 2340 | 2180 | 927 | 1930 | 599 | 585 | 442 | 487 | 642 | 251 | 368 | 1140 | 990.92 |
| 1975 | 2240 | 3100 | 2670 | 2390 | 933 | 716 | 844 | 1170 | 863 | 1630 | 883 | 1030 | 1539.08 |
| 1976 | 2110 | 1430 | 2570 | 2670 | 1530 | 711 | 729 | 411 | 366 | 253 | 419 | 1120 | 1193.25 |
| 1977 | 1600 | 940 | 2860 | 2940 | 500 | 372 | -9999 | -9999 | -9999 | -9999 | -9999 | -9999 | -9999 |
| 1978 | -9999 | -9999 | -9999 | -9999 | -9999 | -9999 | -9999 | -9999 | -9999 | -9999 | -9999 | -9999 | -9999 |
| 1979 | -9999 | -9999 | -9999 | -9999 | -9999 | -9999 | -9999 | -9999 | -9999 | -9999 | -9999 | -9999 | -9999 |
| 1980 | 1503 | 1466 | 3184 | 3566 | 1762 | 559 | 334 | 238 | 200 | 365 | 400 | 388 | 1163.75 |
| 1981 | 272 | 1530 | 802 | 1310 | 284 | 443 | 240 | 198 | 248 | 185 | 218 | 553 | 523.58 |
| 1982 | 1750 | 2592 | 1397 | 1465 | 979 | 460 | 423 | 390 | 197 | 318 | 475 | 2208 | 1054.5 |
| 1983 | 1454 | 2344 | 2247 | 3039 | 1463 | 755 | 452 | 275 | 375 | 283 | 916 | 2646 | 1354.08 |
| 1984 | 2184 | 1322 | 1700 | 1535 | 1557 | 428 | 447 | 1246 | 336 | -9999 | -9999 | -9999 | -9999 |
| |
|
|
|
|
|
|
|
|
|
|
|
|
|
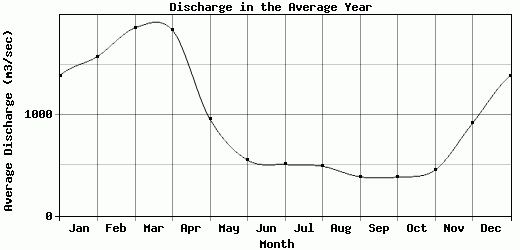
| Avg | 1393.17 | 1581.52 | 1866.13 | 1842.45 | 957.79 | 552.34 | 508.63 | 490.73 | 385.98 | 383.53 | 453.08 | 918.59 | 943.77 |
| |
|
|
|
|
|
|
|
|
|
|
|
|
|
| Std Dev | 794.25 |
641.61 |
760.24 |
943.83 |
497.48 |
232.45 |
239.4 |
331.83 |
156.75 |
227.24 |
247.47 |
732.3 |
244.02 |
| |
|
|
|
|
|
|
|
|
|
|
|
|
|
| | Jan | Feb | Mar | Apr | May | Jun | Jul | Aug | Sep | Oct | Nov | Dec | Avg Annual |
Click here for this table in tab-delimited format.
Tab-delimited format will open in most table browsing software, i.e. Excel, etc.
View this station on the map.
Return to start.