Results
| Country: | Gabon
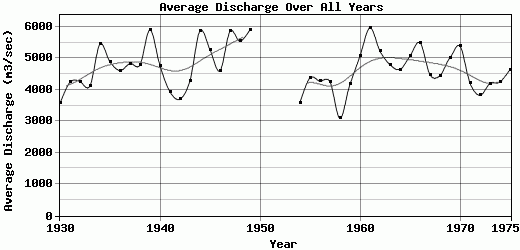
| | Station: | Lambarene | | River: | Ogooue | | Area: | 203500 km2 | | Lat: | 0.68 | | Lon: | 10.23 | | Source: | RivDIS | | PointID: | 17 | | Area Units: | km2 | | Discharge Units: | m3/sec | | Starting Year: | 1930 | | Ending Year: | 1975 | | Total Years: | 46 | | Total Usable Years: | 42 | |
| |
| Year | Jan | Feb | Mar | Apr | May | Jun | Jul | Aug | Sep | Oct | Nov | Dec | Avg Annual |
|---|
| 1930 | 3490 | 3720 | 4600 | 4990 | 5030 | 4220 | 2350 | 1470 | 1250 | 2710 | 4440 | 4560 | 3569.17 |
| 1931 | 4470 | 4470 | 3800 | 4620 | 6290 | 5770 | 2650 | 1730 | 1390 | 2470 | 6230 | 6970 | 4238.33 |
| 1932 | 4720 | 3470 | 4230 | 6220 | 7580 | 4840 | 2630 | 1830 | 1590 | 2770 | 5240 | 5990 | 4259.17 |
| 1933 | 5890 | 5390 | 5490 | 4950 | 4570 | 3090 | 2270 | 1660 | 1380 | 3320 | 4870 | 6630 | 4125.83 |
| 1934 | 4160 | 3850 | 3430 | 5100 | 6710 | 6810 | 3620 | 2390 | 2950 | 6260 | 10800 | 9310 | 5449.17 |
| 1935 | 5910 | 5710 | 6170 | 6520 | 6690 | 5190 | 2940 | 2130 | 1850 | 3550 | 5790 | 6210 | 4888.33 |
| 1936 | 4470 | 4410 | 3560 | 5240 | 6600 | 3500 | 2530 | 1690 | 2570 | 5690 | 7850 | 7240 | 4612.5 |
| 1937 | 3950 | 3540 | 4500 | 7620 | 5930 | 5270 | 2900 | 1930 | 1970 | 4320 | 7880 | 8210 | 4835 |
| 1938 | 5910 | 4460 | 5840 | 6220 | 5860 | 4780 | 3130 | 1820 | 1780 | 3680 | 7180 | 6830 | 4790.83 |
| 1939 | 5030 | 4890 | 4850 | 6070 | 7390 | 7160 | 4370 | 2690 | 2170 | 4640 | 11300 | 10300 | 5905 |
| 1940 | 5900 | 5280 | 4960 | 6270 | 6570 | 4410 | 2820 | 1950 | 1960 | 3760 | 6330 | 6930 | 4761.67 |
| 1941 | 4540 | 3530 | 4120 | 5030 | 6460 | 3910 | 2570 | 1740 | 1860 | 3030 | 5260 | 5180 | 3935.83 |
| 1942 | 4470 | 3920 | 3920 | 4360 | 4780 | 3420 | 2110 | 1430 | 1460 | 3230 | 5720 | 5660 | 3706.67 |
| 1943 | 4000 | 3760 | 4260 | 5210 | 6750 | 4590 | 2530 | 1570 | 1370 | 3840 | 6740 | 6880 | 4291.67 |
| 1944 | 5400 | 4780 | 5160 | 6630 | 8900 | 6220 | 3340 | 2330 | 3140 | 7320 | 9450 | 7820 | 5874.17 |
| 1945 | 5220 | 4500 | 5650 | 6710 | 7980 | 5480 | 3020 | 2140 | 2380 | 6040 | 7780 | 6380 | 5273.33 |
| 1946 | 4070 | 4140 | 4880 | 5890 | 5050 | 3410 | 2130 | 1690 | 1850 | 5360 | 8490 | 8240 | 4600 |
| 1947 | 6150 | 5160 | 5660 | 7020 | 9310 | 8560 | 4040 | 2670 | 2340 | 4300 | 7410 | 7710 | 5860.83 |
| 1948 | 5780 | 5290 | 6710 | 6430 | 6090 | 4680 | 3100 | 2120 | 2130 | 5360 | 9780 | 9070 | 5545 |
| 1949 | 5600 | 5420 | 6010 | 7760 | 6580 | 5040 | 3400 | 2640 | 2770 | 7420 | 10600 | 7700 | 5911.67 |
| 1950 | -9999 | -9999 | -9999 | -9999 | -9999 | -9999 | -9999 | -9999 | -9999 | -9999 | -9999 | -9999 | -9999 |
| 1951 | -9999 | -9999 | -9999 | -9999 | -9999 | -9999 | -9999 | -9999 | -9999 | -9999 | -9999 | -9999 | -9999 |
| 1952 | -9999 | -9999 | -9999 | -9999 | -9999 | -9999 | -9999 | -9999 | -9999 | -9999 | -9999 | -9999 | -9999 |
| 1953 | -9999 | -9999 | -9999 | -9999 | -9999 | -9999 | -9999 | -9999 | -9999 | -9999 | -9999 | -9999 | -9999 |
| 1954 | 2820 | 3410 | 4110 | 5250 | 5290 | 3060 | 2130 | 1300 | 1470 | 3610 | 5690 | 5020 | 3596.67 |
| 1955 | 4210 | 3290 | 3840 | 5680 | 6040 | 4680 | 2590 | 1900 | 2060 | 3820 | 7530 | 6960 | 4383.33 |
| 1956 | 4490 | 3770 | 3920 | 5300 | 5970 | 3450 | 2200 | 1550 | 1400 | 3400 | 7790 | 8100 | 4278.33 |
| 1957 | 4810 | 3590 | 4390 | 5610 | 5000 | 4160 | 2590 | 1930 | 1660 | 3220 | 6650 | 7420 | 4252.5 |
| 1958 | 4480 | 3210 | 2960 | 3840 | 4030 | 2700 | 1840 | 1300 | 979 | 2460 | 4210 | 5110 | 3093.25 |
| 1959 | 3830 | 3590 | 3480 | 3930 | 6600 | 2890 | 2160 | 1690 | 1580 | 4450 | 8250 | 7700 | 4179.17 |
| 1960 | 4230 | 4210 | 5010 | 6730 | 6440 | 5030 | 3010 | 2160 | 2290 | 5080 | 9350 | 7340 | 5073.33 |
| 1961 | 6040 | 6580 | 6610 | 7940 | 7500 | 4380 | 2850 | 2190 | 2260 | 6080 | 11000 | 8210 | 5970 |
| 1962 | 4770 | 4630 | 5230 | 7070 | 8750 | 5530 | 3010 | 2120 | 1910 | 4250 | 8210 | 7240 | 5226.67 |
| 1963 | 4740 | 4220 | 5840 | 5820 | 7110 | 5000 | 3220 | 2410 | 2170 | 4040 | 6830 | 6190 | 4799.17 |
| 1964 | 6210 | 4210 | 4380 | 5020 | 6350 | 4340 | 2830 | 1900 | 1810 | 3320 | 6900 | 8500 | 4647.5 |
| 1965 | 5320 | 4610 | 6140 | 8570 | 7140 | 4390 | 2700 | 2140 | 2100 | 3750 | 7510 | 6520 | 5074.17 |
| 1966 | 4280 | 5010 | 4930 | 7920 | 9470 | 5920 | 3800 | 2480 | 2150 | 3860 | 8320 | 7860 | 5500 |
| 1967 | 4500 | 4300 | 4420 | 3630 | 4410 | 3200 | 2100 | 1600 | 1810 | 6180 | 10100 | 7530 | 4481.67 |
| 1968 | 4872 | 4018 | 3391 | 5036 | 6883 | 4709 | 2748 | 1823 | 2101 | 3924 | 6348 | 7557 | 4450.83 |
| 1969 | 5449 | 4206 | 5424 | 6720 | 7607 | 5283 | 2756 | 2176 | 2093 | 4143 | 7251 | 7134 | 5020.17 |
| 1970 | 4369 | 4857 | 7577 | 7618 | 7089 | 4427 | 2770 | 2193 | 2357 | 5170 | 9533 | 6676 | 5386.33 |
| 1971 | 4884 | 3270 | 3896 | 5840 | 4775 | 3357 | 2160 | 1649 | 1989 | 3507 | 8213 | 7028 | 4214 |
| 1972 | 3939 | 3433 | 3839 | 4584 | 4998 | 3746 | 2219 | 1784 | 1739 | 2819 | 6871 | 5943 | 3826.17 |
| 1973 | 4300 | 4100 | 3790 | 5000 | 6690 | 4420 | 2500 | 1720 | 1900 | 3860 | 7100 | 5010 | 4199.17 |
| 1974 | 4020 | 4430 | 4540 | 5270 | 5070 | 3420 | 2000 | 1570 | 1890 | 4100 | 8260 | 6460 | 4252.5 |
| 1975 | 4100 | 4900 | 4850 | 5440 | 5560 | 4390 | 2700 | 1840 | 1670 | 4970 | 8940 | 6350 | 4642.5 |
| |
|
|
|
|
|
|
|
|
|
|
|
|
|
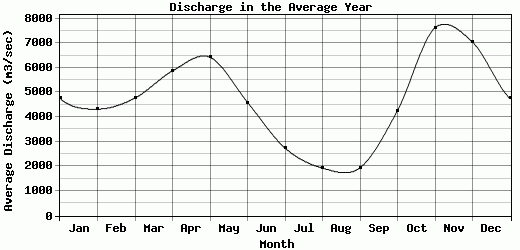
| Avg | 4756.98 | 4322.24 | 4770.64 | 5873.29 | 6426 | 4591.24 | 2746.02 | 1929.64 | 1941.62 | 4263.88 | 7618.95 | 7039.95 | 4690.04 |
| |
|
|
|
|
|
|
|
|
|
|
|
|
|
| Std Dev | 784.09 |
747.74 |
1019.34 |
1173.55 |
1290.31 |
1192.02 |
548.35 |
353.97 |
441.63 |
1221.89 |
1759.1 |
1193.6 |
700.19 |
| |
|
|
|
|
|
|
|
|
|
|
|
|
|
| | Jan | Feb | Mar | Apr | May | Jun | Jul | Aug | Sep | Oct | Nov | Dec | Avg Annual |
Click here for this table in tab-delimited format.
Tab-delimited format will open in most table browsing software, i.e. Excel, etc.
View this station on the map.
Return to start.