Results
| Country: | U.S.A.
| | Station: | OWENSBORO, KY | | River: | OHIO RIVER | | Area: | 251733.08 | | Lat: | 37.77 | | Lon: | -87.11 | | Source: | USGS | | PointID: | 3303500 | | Area Units: | km2 | | Discharge Units: | m3/sec | | Starting Year: | 1918 | | Ending Year: | 1951 | | Total Years: | 34 | | Total Usable Years: | 31 | |
| |
| Year | Jan | Feb | Mar | Apr | May | Jun | Jul | Aug | Sep | Oct | Nov | Dec | Avg Annual |
|---|
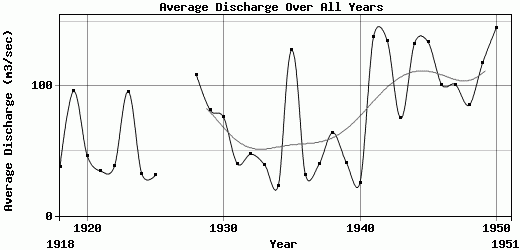
| 1918 | 14.16 | 18.42 | 34.59 | 30.84 | 51.38 | 99.73 | 36.02 | 32.03 | 27.4 | 53.56 | 29.53 | 24.1 | 37.65 |
| 1919 | 29.6 | 43.08 | 120.24 | 125.58 | 180.14 | 315.95 | 67.63 | 32.44 | 111.12 | 57.06 | 35.65 | 37.12 | 96.3 |
| 1920 | 40.69 | 46.39 | 33.69 | 78.03 | 83.05 | 40.99 | 28.62 | 57.19 | 81.89 | 21.39 | 24.69 | 20.56 | 46.43 |
| 1921 | 22.02 | 33.6 | 23.83 | 32.85 | 70.18 | 84.34 | 56.55 | 33.65 | 26.47 | 9.59 | 9.07 | 10.81 | 34.41 |
| 1922 | 7.18 | 13.99 | 43.24 | 55.44 | 64.78 | 48.7 | 109.13 | 37.22 | 12.12 | 5.44 | 46.49 | 16.27 | 38.33 |
| 1923 | 19.03 | 13.35 | 24.71 | 26.48 | 155.76 | 459.14 | 179.2 | 81.26 | 65.06 | 59.33 | 37.74 | 30.64 | 95.98 |
| 1924 | 23.37 | 37.27 | 40.61 | 55.08 | 43.73 | 28.97 | 45.7 | 61.32 | 16.55 | 9.69 | 12.55 | 12.03 | 32.24 |
| 1925 | 9.06 | 38.21 | 34.27 | 44.98 | 26.81 | 67.24 | 25.64 | 49.95 | 38.55 | 13.03 | 15.02 | 13.76 | 31.38 |
| 1926 | -9999 | -9999 | -9999 | -9999 | -9999 | -9999 | -9999 | -9999 | -9999 | -9999 | -9999 | -9999 | -9999 |
| 1927 | -9999 | -9999 | -9999 | -9999 | -9999 | -9999 | -9999 | -9999 | -9999 | -9999 | -9999 | -9999 | -9999 |
| 1928 | 25 | 45.75 | 39.75 | 46.72 | 40.42 | 200.1 | 334.17 | 354.15 | 69.83 | 46.33 | 65.67 | 39.78 | 108.97 |
| 1929 | 37.18 | 31.28 | 91.12 | 127.72 | 168.19 | 219.81 | 124.53 | 57.4 | 28.79 | 30.68 | 35.23 | 29.01 | 81.74 |
| 1930 | 24.96 | 38.63 | 31.88 | 48.75 | 194.49 | 215.96 | 42.97 | 39.93 | 80.59 | 83.92 | 63.95 | 45.67 | 75.98 |
| 1931 | 31.34 | 38.73 | 37.71 | 62.15 | 82.84 | 51.75 | 43.7 | 45.68 | 21.12 | 17.25 | 26.11 | 22.25 | 40.05 |
| 1932 | 19.49 | 61.07 | 52.16 | 32.94 | 31.03 | 102.2 | 97.08 | 32.17 | 89.12 | 23.63 | 16.71 | 13.95 | 47.63 |
| 1933 | 17.67 | 19.73 | 30.09 | 63.99 | 62.96 | 16.86 | 24.61 | 49.14 | 123.12 | 27.87 | 16.16 | 20.73 | 39.41 |
| 1934 | 19.31 | 19.79 | 23.96 | 20.54 | 25.03 | 87.18 | 21.52 | 4.49 | 22.33 | 7.79 | 10.2 | 11.19 | 22.78 |
| 1935 | 11.52 | 17.61 | 16.82 | 15.92 | 161.65 | 755.51 | 199.77 | 57.91 | 152.1 | 63.83 | 44.1 | 38.8 | 127.96 |
| 1936 | 25.3 | 19.38 | 43.24 | 32.1 | 117.79 | 61.47 | 14.84 | 6.36 | 16.99 | 20.34 | 8.08 | 12.59 | 31.54 |
| 1937 | 8.13 | 76.14 | 40.43 | 20.82 | 20.47 | 122.68 | 73.56 | 45.96 | 41.74 | 10.26 | 7.63 | 8.61 | 39.7 |
| 1938 | 12.07 | 16.97 | 23.65 | 22.54 | 164.23 | 297.21 | 76.23 | 71.12 | 45.09 | 15.56 | 14.05 | 12.58 | 64.27 |
| 1939 | 15.22 | 11.68 | 34.88 | 50.32 | 37.33 | 159.95 | 67.82 | 85.21 | 11.94 | 6.18 | 5.26 | 6.35 | 41.01 |
| 1940 | 3.29 | 10.9 | 26.65 | 17.69 | 39.13 | 51.35 | 26.88 | 39.09 | 42.55 | 19.64 | 14.35 | 15.12 | 25.55 |
| 1941 | 14.6 | 25 | 23.78 | 36.34 | 53.94 | 398.9 | 133.99 | 117.85 | 223.07 | 440.29 | 127.23 | 67.84 | 138.57 |
| 1942 | 59.27 | 57.14 | 73.16 | 135.08 | 198.45 | 378.65 | 118.37 | 94.6 | 313.91 | 105.36 | 48.48 | 42.39 | 135.41 |
| 1943 | 41.66 | 90.09 | 42.27 | 101.96 | 74.4 | 359.61 | 96.54 | 29.83 | 21.36 | 17.33 | 14.14 | 14.03 | 75.27 |
| 1944 | 16.89 | 24.09 | 64.84 | 299.79 | 329.8 | 168.32 | 201.32 | 218.94 | 121.85 | 49.34 | 38.89 | 65.56 | 133.3 |
| 1945 | 44.9 | 50.78 | 88.77 | 245.69 | 330.72 | 249.61 | 369.91 | 85.93 | 44.58 | 45.43 | 29.88 | 23.18 | 134.12 |
| 1946 | 32.37 | 37.46 | 42.15 | 33.49 | 51.79 | 72.48 | 122.66 | 39.63 | 299.99 | 259.61 | 159.85 | 64.11 | 101.3 |
| 1947 | 46.41 | 46.81 | 73.47 | 208.21 | 106.8 | 454.95 | 157.24 | 42.36 | 21.5 | 15.74 | 18.04 | 25.08 | 101.38 |
| 1948 | 22.71 | 42.03 | 156.32 | 47.27 | 52.55 | 136.15 | 374.91 | 86.45 | 37 | 18.8 | 25.96 | 25.44 | 85.47 |
| 1949 | 81.83 | 216.43 | 169.35 | 75.65 | 209.05 | 327.52 | 124.69 | 52.59 | 45.15 | 56.31 | 32.03 | 29.66 | 118.36 |
| 1950 | 27.09 | 34.29 | 34.35 | 29.24 | 118.03 | 83.76 | 486.16 | 403.05 | 205.45 | 205.54 | 74.91 | 42.25 | 145.34 |
| 1951 | -9999 | -9999 | -9999 | -9999 | -9999 | -9999 | -9999 | -9999 | -9999 | -9999 | -9999 | -9999 | -9999 |
| |
|
|
|
|
|
|
|
|
|
|
|
|
|
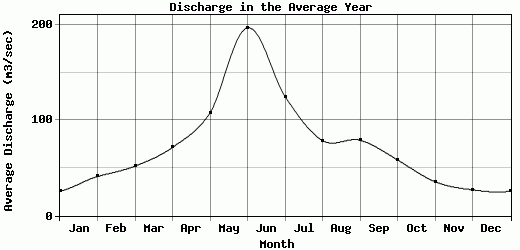
| Avg | 25.91 | 41.16 | 52.13 | 71.75 | 107.97 | 197.32 | 125.22 | 78.87 | 79.3 | 58.58 | 35.73 | 27.14 | 75.09 |
| |
|
|
|
|
|
|
|
|
|
|
|
|
|
| Std Dev | 16.32 |
36.95 |
37.02 |
67.69 |
81.83 |
166.54 |
116.33 |
87.66 |
80.07 |
88.78 |
33.61 |
16.65 |
39.98 |
| |
|
|
|
|
|
|
|
|
|
|
|
|
|
| | Jan | Feb | Mar | Apr | May | Jun | Jul | Aug | Sep | Oct | Nov | Dec | Avg Annual |
Click here for this table in tab-delimited format.
Tab-delimited format will open in most table browsing software, i.e. Excel, etc.
View this station on the map.
Return to start.