Results
| Country: | U.S.S.R.
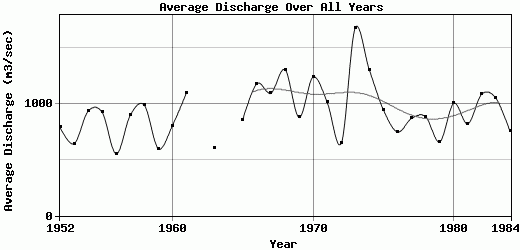
| | Station: | downstreamof Pur River | | River: | Olenek | | Area: | 198000 km2 | | Lat: | 72.12 | | Lon: | 123.22 | | Source: | RivDIS | | PointID: | 1268 | | Area Units: | km2 | | Discharge Units: | m3/sec | | Starting Year: | 1952 | | Ending Year: | 1984 | | Total Years: | 33 | | Total Usable Years: | 31 | |
| |
| Year | Jan | Feb | Mar | Apr | May | Jun | Jul | Aug | Sep | Oct | Nov | Dec | Avg Annual |
|---|
| 1952 | 8.5 | 5.8 | 5.2 | 3.6 | 20 | 5980 | 1450 | 672 | 1050 | 216 | 45.5 | 11.5 | 789.01 |
| 1953 | 3.1 | 0.9 | 0.9 | 2.2 | 1300 | 2810 | 763 | 678 | 1440 | 551 | 116 | 30 | 641.26 |
| 1954 | 12 | 8.4 | 3.1 | 1 | 9.1 | 5170 | 3300 | 1220 | 1100 | 289 | 57.5 | 19.5 | 932.47 |
| 1955 | 12 | 10 | 5.5 | 1.4 | 5.4 | 6880 | 1130 | 1440 | 1320 | 197 | 53 | 11.5 | 922.15 |
| 1956 | 3.7 | 3.2 | 1.4 | 3 | 2.2 | 5440 | 804 | 135 | 161 | 36.5 | 14.5 | 5.4 | 550.82 |
| 1957 | 2.2 | 1.5 | 0.2 | 0 | 0.6 | 7750 | 613 | 1540 | 622 | 166 | 44.5 | 28 | 897.33 |
| 1958 | 6.2 | 2.6 | 1.1 | 0.7 | 0.8 | 7000 | 1930 | 864 | 1550 | 383 | 74 | 23.5 | 986.33 |
| 1959 | 13.2 | 5 | 1.6 | 0.7 | 22.5 | 6000 | 461 | 77.5 | 236 | 229 | 102 | 26.5 | 597.92 |
| 1960 | 9.8 | 3.8 | 1.7 | 2.2 | 407 | 3730 | 2060 | 2000 | 1140 | 196 | 76 | 22.5 | 804.08 |
| 1961 | 4.8 | 2.1 | 1.6 | 3 | 1.3 | 6300 | 3180 | 1750 | 1510 | 350 | 59.5 | 37.5 | 1099.98 |
| 1962 | 16 | 2.9 | 2.8 | 3.7 | -9999 | -9999 | 3590 | 375 | 385 | -9999 | -9999 | 3.4 | -9999 |
| 1963 | 2.3 | 1.4 | 0.9 | 0.6 | 0.3 | 4690 | 1570 | 514 | 318 | 139 | 32 | 6.9 | 606.28 |
| 1964 | -9999 | -9999 | -9999 | -9999 | -9999 | -9999 | -9999 | -9999 | -9999 | -9999 | -9999 | -9999 | -9999 |
| 1965 | 7 | 3 | 1 | 0 | 3 | 5640 | 3440 | 245 | 491 | 356 | 83 | 24 | 857.75 |
| 1966 | 7 | 2 | 1 | 0 | 216 | 8000 | 3010 | 662 | 1670 | 414 | 116 | 45 | 1178.58 |
| 1967 | 11 | 5 | 5 | 4 | 351 | 10400 | 1130 | 127 | 556 | 443 | 72 | 25 | 1094.08 |
| 1968 | 11 | 6 | 5 | 4 | 524 | 9410 | 2510 | 914 | 1940 | 240 | 61 | 11 | 1303 |
| 1969 | 3.2 | 1.5 | 0.5 | 0.6 | 1.4 | 5940 | 2100 | 1380 | 782 | 233 | 79.5 | 20 | 878.48 |
| 1970 | 7.1 | 3.8 | 3.2 | 2 | 3.7 | 7960 | 3550 | 1320 | 1810 | 113 | 45 | 23 | 1236.73 |
| 1971 | 9.9 | 3.9 | 2.6 | 2.5 | 4.7 | 8400 | 1850 | 426 | 892 | 438 | 82 | 29.5 | 1011.76 |
| 1972 | 8.6 | 4 | 2.9 | 1.3 | 4.5 | 6250 | 987 | 239 | 92.5 | 100 | 43 | 7.1 | 644.99 |
| 1973 | 1.8 | 1.6 | 0.7 | 0.2 | 373 | 11300 | 5550 | 988 | 1390 | 382 | 102 | 34.5 | 1676.98 |
| 1974 | 7.4 | 3.2 | 2.6 | 2.1 | 1.6 | 7690 | 4840 | 1740 | 748 | 428 | 88.5 | 22 | 1297.78 |
| 1975 | 4.7 | 3.2 | 3.4 | 2.5 | 2810 | 5980 | 1030 | 561 | 555 | 274 | 74 | 25.5 | 943.61 |
| 1976 | 7.3 | 2.2 | 1 | 1.2 | 3.2 | 4690 | 1880 | 938 | 1200 | 179 | 50 | 16 | 747.33 |
| 1977 | 4.4 | 3.3 | 1.3 | 1.9 | 806 | 6090 | 1230 | 887 | 1030 | 266 | 82.5 | 20.5 | 868.58 |
| 1978 | 4.2 | 2.1 | 1.5 | 2.4 | 1.7 | 5660 | 2110 | 1090 | 1500 | 143 | 64 | 30 | 884.08 |
| 1979 | 8.1 | 3 | 1.5 | 1.6 | 1.6 | 5340 | 750 | 783 | 745 | 147 | 104 | 27 | 659.32 |
| 1980 | 6.8 | 3.2 | 2.4 | 1.7 | 3.5 | 6730 | 1870 | 1920 | 1120 | 280 | 64 | 27 | 1002.38 |
| 1981 | 7.4 | 4.7 | 2.6 | 3.1 | 832 | 6810 | 1040 | 384 | 483 | 181 | 64 | 32 | 820.32 |
| 1982 | 9.6 | 3.6 | 2.6 | 1.7 | 1.6 | 7320 | 2560 | 1130 | 1090 | 798 | 87 | 33.5 | 1086.47 |
| 1983 | 7.3 | 5.2 | 4.4 | 3.3 | 84.5 | 6650 | 1870 | 1060 | 2220 | 511 | 127 | 35.5 | 1048.18 |
| 1984 | 13.5 | 5.5 | 4 | 3.5 | 116 | 6940 | 763 | 128 | 695 | 252 | 88.5 | 17 | 752.17 |
| |
|
|
|
|
|
|
|
|
|
|
|
|
|
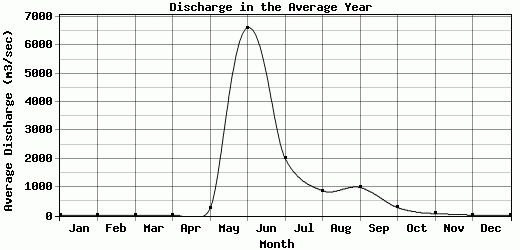
| Avg | 7.53 | 3.68 | 2.35 | 1.93 | 255.23 | 6611.29 | 2028.78 | 880.86 | 995.05 | 288.08 | 72.63 | 22.85 | 929.68 |
| |
|
|
|
|
|
|
|
|
|
|
|
|
|
| Std Dev | 3.55 |
1.96 |
1.47 |
1.21 |
558.78 |
1737.96 |
1227.95 |
545.6 |
534.21 |
155.61 |
25.62 |
9.88 |
242.44 |
| |
|
|
|
|
|
|
|
|
|
|
|
|
|
| | Jan | Feb | Mar | Apr | May | Jun | Jul | Aug | Sep | Oct | Nov | Dec | Avg Annual |
Click here for this table in tab-delimited format.
Tab-delimited format will open in most table browsing software, i.e. Excel, etc.
View this station on the map.
Return to start.