Results
| Country: | U.S.A.
| | Station: | Merrill,Missisippi | | River: | Pascagoula | | Area: | 17094 km2 | | Lat: | 30.98 | | Lon: | -88.73 | | Source: | | | PointID: | 389 | | Area Units: | km2 | | Discharge Units: | m3/sec | | Starting Year: | 1930 | | Ending Year: | 1984 | | Total Years: | 55 | | Total Usable Years: | 54 | |
| |
| Year | Jan | Feb | Mar | Apr | May | Jun | Jul | Aug | Sep | Oct | Nov | Dec | Avg Annual |
|---|
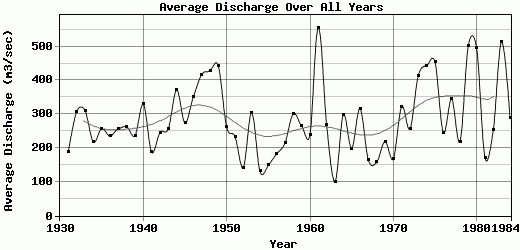
| 1930 | -9999 | -9999 | -9999 | -9999 | -9999 | -9999 | -9999 | -9999 | -9999 | 69 | 319 | 359 | -9999 |
| 1931 | 396 | 225 | 286 | 280 | 136 | 60 | 217 | 231 | 47 | 34 | 39 | 319 | 189.17 |
| 1932 | 727 | 688 | 267 | 241 | 336 | 115 | 56 | 69 | 161 | 231 | 220 | 572 | 306.92 |
| 1933 | 555 | 588 | 588 | 931 | 226 | 74 | 362 | 182 | 75 | 46 | 43 | 61 | 310.92 |
| 1934 | 121 | 278 | 540 | 206 | 202 | 96 | 200 | 177 | 73 | 123 | 323 | 273 | 217.67 |
| 1935 | 402 | 336 | 994 | 472 | 381 | 110 | 74 | 79 | 58 | 33 | 44 | 106 | 257.42 |
| 1936 | 712 | 826 | 186 | 284 | 300 | 81 | 103 | 84 | 49 | 22 | 25 | 149 | 235.08 |
| 1937 | 874 | 568 | 458 | 329 | 200 | 101 | 60 | 61 | 77 | 99 | 128 | 132 | 257.25 |
| 1938 | 248 | 268 | 410 | 1495 | 147 | 116 | 126 | 172 | 43 | 28 | 40 | 64 | 263.08 |
| 1939 | 183 | 498 | 568 | 436 | 134 | 458 | 178 | 126 | 81 | 65 | 43 | 65 | 236.25 |
| 1940 | 127 | 723 | 286 | 474 | 491 | 189 | 969 | 133 | 73 | 52 | 64 | 373 | 329.5 |
| 1941 | 245 | 228 | 493 | 308 | 111 | 68 | 212 | 102 | 55 | 36 | 57 | 339 | 187.83 |
| 1942 | 389 | 330 | 772 | 351 | 191 | 99 | 94 | 187 | 122 | 76 | 103 | 233 | 245.58 |
| 1943 | 486 | 359 | 1011 | 527 | 121 | 80 | 80 | 58 | 90 | 40 | 111 | 122 | 257.08 |
| 1944 | 322 | 428 | 836 | 1008 | 763 | 148 | 79 | 219 | 155 | 62 | 124 | 313 | 371.42 |
| 1945 | 404 | 551 | 564 | 536 | 340 | 164 | 154 | 98 | 52 | 80 | 91 | 249 | 273.58 |
| 1946 | 566 | 643 | 736 | 257 | 566 | 290 | 294 | 311 | 131 | 70 | 167 | 180 | 350.92 |
| 1947 | 1027 | 344 | 744 | 1084 | 487 | 239 | 106 | 73 | 80 | 54 | 231 | 536 | 417.08 |
| 1948 | 260 | 713 | 1330 | 516 | 140 | 85 | 101 | 148 | 170 | 98 | 612 | 967 | 428.33 |
| 1949 | 559 | 939 | 720 | 881 | 539 | 321 | 386 | 268 | 335 | 107 | 84 | 172 | 442.58 |
| 1950 | 537 | 691 | 560 | 230 | 330 | 105 | 128 | 129 | 135 | 63 | 64 | 168 | 261.67 |
| 1951 | 252 | 533 | 468 | 861 | 100 | 97 | 83 | 51 | 66 | 46 | 58 | 191 | 233.83 |
| 1952 | 154 | 314 | 373 | 266 | 205 | 87 | 53 | 52 | 45 | 25 | 37 | 93 | 142 |
| 1953 | 255 | 444 | 627 | 402 | 779 | 91 | 159 | 91 | 62 | 32 | 50 | 654 | 303.83 |
| 1954 | 254 | 241 | 221 | 398 | 154 | 59 | 79 | 33 | 25 | 26 | 30 | 45 | 130.42 |
| 1955 | 168 | 302 | 132 | 541 | 115 | 60 | 94 | 180 | 40 | 31 | 35 | 83 | 148.42 |
| 1956 | 65 | 604 | 636 | 317 | 82 | 81 | 137 | 56 | 36 | 40 | 31 | 109 | 182.83 |
| 1957 | 75 | 118 | 140 | 375 | 174 | 75 | 87 | 45 | 311 | 298 | 519 | 361 | 214.83 |
| 1958 | 358 | 472 | 665 | 319 | 454 | 168 | 389 | 197 | 289 | 129 | 78 | 106 | 302 |
| 1959 | 228 | 478 | 305 | 369 | 164 | 509 | 168 | 121 | 107 | 235 | 298 | 190 | 264.33 |
| 1960 | 306 | 547 | 505 | 493 | 383 | 64 | 60 | 151 | 91 | 75 | 114 | 89 | 239.83 |
| 1961 | 281 | 1260 | 1347 | 1091 | 138 | 241 | 315 | 151 | 150 | 70 | 339 | 1280 | 555.25 |
| 1962 | 903 | 481 | 335 | 592 | 375 | 156 | 72 | 72 | 46 | 53 | 59 | 63 | 267.25 |
| 1963 | 250 | 262 | 287 | 86 | 47 | 42 | 46 | 37 | 34 | 21 | 25 | 68 | 100.42 |
| 1964 | 209 | 223 | 790 | 853 | 368 | 92 | 140 | 94 | 43 | 171 | 103 | 490 | 298 |
| 1965 | 420 | 695 | 445 | 200 | 74 | 75 | 75 | 101 | 74 | 69 | 43 | 107 | 198.17 |
| 1966 | 317 | 1417 | 755 | 270 | 407 | 99 | 75 | 105 | 66 | 69 | 95 | 122 | 316.42 |
| 1967 | 250 | 274 | 143 | 126 | 240 | 72 | 79 | 77 | 59 | 39 | 59 | 560 | 164.83 |
| 1968 | 393 | 153 | 279 | 316 | 175 | 60 | 44 | 50.5 | 44.5 | 30 | 45 | 301 | 157.58 |
| 1969 | 272 | 277 | 440 | 913 | 239 | 65 | 75.5 | 103 | 53.5 | 40 | 40 | 110 | 219 |
| 1970 | 201 | 210 | 411 | 237 | 145 | 66 | 83 | 125 | 66.5 | 172 | 105 | 193 | 167.88 |
| 1971 | 335 | 482 | 984 | 374 | 355 | 102 | 112 | 145 | 155 | 70 | 63 | 690 | 322.25 |
| 1972 | 782 | 634 | 469 | 220 | 261 | 68 | 72 | 47 | 33 | 39 | 72 | 384 | 256.75 |
| 1973 | 488 | 483 | 842 | 1140 | 679 | 281 | 141 | 130 | 162 | 89 | 115 | 423 | 414.42 |
| 1974 | 1140 | 737 | 387 | 1270 | 279 | 239 | 90 | 115 | 386 | 104 | 177 | 400 | 443.67 |
| 1975 | 966 | 713 | 655 | 667 | 703 | 308 | 199 | 326 | 178 | 351 | 153 | 230 | 454.08 |
| 1976 | 402 | 251 | 558 | 744 | 279 | 142 | 80 | 50 | 55 | 45 | 90 | 248 | 245.33 |
| 1977 | 490 | 253 | 960 | 817 | 232 | 70 | 85 | 127 | 224 | 164 | 380 | 335 | 344.75 |
| 1978 | 497 | 434 | 282 | 233 | 537 | 237 | 95 | 75 | 50 | 35 | 38 | 111 | 218.67 |
| 1979 | 525 | 888 | 1240 | 1080 | 271 | 184 | 296 | 140 | 423 | 108 | 419 | 461 | 502.92 |
| 1980 | 623 | 566 | 843 | 2003 | 1032 | 227 | 142 | 79.5 | 54 | 98.5 | 143 | 130 | 495.08 |
| 1981 | 88.5 | 486 | 338 | 524 | 108 | 97.5 | 84 | 52.5 | 82.5 | 38.5 | 40.5 | 115 | 171.25 |
| 1982 | 290 | 688 | 268 | 313 | 143 | 61 | 110 | 202 | 60 | 56 | 115 | 731 | 253.08 |
| 1983 | 526 | 1182 | 918 | 1596 | 546 | 307 | 211 | 110 | 96 | 71 | 163 | 438 | 513.67 |
| 1984 | 524 | 400 | 576 | 411 | 277 | 80.5 | 103 | 156 | 65.5 | 436 | 201 | 246 | 289.67 |
| |
|
|
|
|
|
|
|
|
|
|
|
|
|
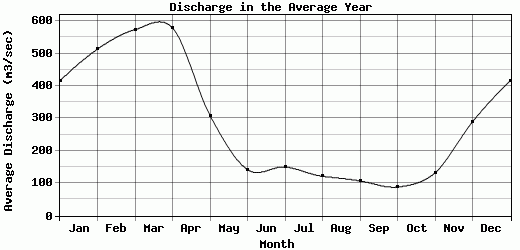
| Avg | 415.32 | 513.44 | 573.57 | 578.94 | 308.54 | 141.89 | 150.23 | 121.38 | 107.31 | 88.44 | 132.08 | 289.25 | 284.67 |
| |
|
|
|
|
|
|
|
|
|
|
|
|
|
| Std Dev | 246.55 |
270.92 |
294.88 |
403.05 |
207.11 |
101.12 |
141.41 |
66.43 |
89.83 |
82.09 |
127.69 |
239.94 |
105.4 |
| |
|
|
|
|
|
|
|
|
|
|
|
|
|
| | Jan | Feb | Mar | Apr | May | Jun | Jul | Aug | Sep | Oct | Nov | Dec | Avg Annual |
Click here for this table in tab-delimited format.
Tab-delimited format will open in most table browsing software, i.e. Excel, etc.
View this station on the map.
Return to start.