Results
| Country: | U.S.A.
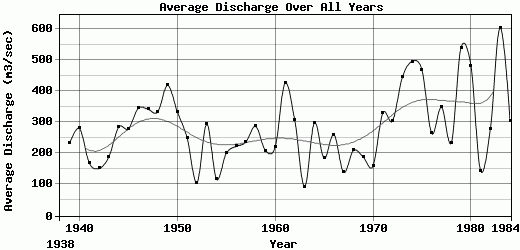
| | Station: | Bogalusia,Lousiana | | River: | Pearl | | Area: | 17172 km2 | | Lat: | 30.8 | | Lon: | -89.81 | | Source: | | | PointID: | 388 | | Area Units: | km2 | | Discharge Units: | m3/sec | | Starting Year: | 1938 | | Ending Year: | 1984 | | Total Years: | 47 | | Total Usable Years: | 46 | |
| |
| Year | Jan | Feb | Mar | Apr | May | Jun | Jul | Aug | Sep | Oct | Nov | Dec | Avg Annual |
|---|
| 1938 | -9999 | -9999 | -9999 | -9999 | -9999 | -9999 | -9999 | -9999 | -9999 | 42 | 43 | 58 | -9999 |
| 1939 | 237 | 590 | 693 | 418 | 153 | 322 | 113 | 75 | 47 | 55 | 40 | 56 | 233.25 |
| 1940 | 92 | 440 | 262 | 439 | 418 | 94 | 752 | 229 | 68 | 56 | 74 | 438 | 280.17 |
| 1941 | 350 | 241 | 365 | 314 | 118 | 67 | 135 | 101 | 52 | 45 | 55 | 185 | 169 |
| 1942 | 228 | 199 | 409 | 203 | 161 | 81 | 82 | 120 | 90 | 56 | 62 | 134 | 152.08 |
| 1943 | 318 | 234 | 595 | 557 | 102 | 66 | 62 | 47 | 88 | 42 | 75 | 82 | 189 |
| 1944 | 212 | 307 | 635 | 1001 | 642 | 141 | 70 | 88 | 64 | 49 | 77 | 126 | 284.33 |
| 1945 | 287 | 525 | 869 | 560 | 221 | 240 | 171 | 116 | 63 | 80 | 66 | 152 | 279.17 |
| 1946 | 516 | 879 | 716 | 319 | 390 | 365 | 259 | 214 | 78 | 57 | 158 | 185 | 344.67 |
| 1947 | 854 | 497 | 536 | 920 | 375 | 151 | 98 | 73 | 95 | 56 | 128 | 318 | 341.75 |
| 1948 | 195 | 609 | 1003 | 409 | 120 | 71 | 68 | 79 | 84 | 59 | 319 | 986 | 333.5 |
| 1949 | 885 | 1030 | 638 | 897 | 417 | 269 | 263 | 181 | 179 | 88 | 84 | 95 | 418.83 |
| 1950 | 841 | 814 | 803 | 269 | 451 | 141 | 102 | 165 | 94 | 91 | 81 | 149 | 333.42 |
| 1951 | 302 | 704 | 451 | 840 | 190 | 83 | 77 | 58 | 54 | 43 | 48 | 136 | 248.83 |
| 1952 | 121 | 217 | 252 | 204 | 127 | 75 | 50 | 48 | 40 | 33 | 39 | 63 | 105.75 |
| 1953 | 202 | 429 | 789 | 293 | 1045 | 159 | 110 | 101 | 58 | 39 | 47 | 248 | 293.33 |
| 1954 | 159 | 213 | 149 | 265 | 285 | 67 | 68 | 42 | 35 | 39 | 37 | 48 | 117.25 |
| 1955 | 198 | 423 | 286 | 770 | 196 | 95 | 112 | 118 | 45 | 38 | 40 | 83 | 200.33 |
| 1956 | 61 | 749 | 686 | 621 | 124 | 106 | 57 | 50 | 40 | 38 | 39 | 98 | 222.42 |
| 1957 | 107 | 205 | 230 | 645 | 154 | 104 | 159 | 63 | 92 | 147 | 457 | 475 | 236.5 |
| 1958 | 298 | 365 | 544 | 325 | 726 | 226 | 294 | 185 | 141 | 151 | 82 | 107 | 287 |
| 1959 | 228 | 534 | 297 | 307 | 224 | 256 | 93 | 85 | 75 | 89 | 125 | 197 | 209.17 |
| 1960 | 325 | 592 | 693 | 268 | 281 | 64 | 52 | 121 | 67 | 58 | 58 | 67 | 220.5 |
| 1961 | 209 | 646 | 1091 | 913 | 129 | 174 | 285 | 127 | 103 | 60 | 355 | 1010 | 425.17 |
| 1962 | 1138 | 607 | 407 | 686 | 325 | 132 | 79 | 73 | 56 | 56 | 55 | 60 | 306.17 |
| 1963 | 170 | 216 | 254 | 91 | 54 | 46 | 63 | 54 | 41 | 31 | 34 | 64 | 93.17 |
| 1964 | 170 | 165 | 787 | 726 | 526 | 72 | 132 | 94 | 60 | 255 | 87 | 504 | 298.17 |
| 1965 | 239 | 598 | 514 | 291 | 67 | 57 | 56 | 69 | 97 | 95 | 54 | 78 | 184.58 |
| 1966 | 320 | 970 | 477 | 229 | 565 | 125 | 70 | 77 | 67 | 62 | 80 | 84 | 260.5 |
| 1967 | 136 | 189 | 135 | 111 | 298 | 138 | 98 | 62 | 63 | 43 | 48 | 346 | 138.92 |
| 1968 | 667 | 192 | 307 | 430 | 318 | 96 | 64.5 | 64 | 58 | 39.5 | 40.5 | 240 | 209.71 |
| 1969 | 218 | 232 | 402 | 736 | 317 | 53.5 | 44 | 66 | 49.5 | 39 | 36.5 | 67 | 188.38 |
| 1970 | 220 | 122 | 370 | 288 | 277 | 80 | 58 | 74.5 | 54.5 | 148 | 108 | 113 | 159.42 |
| 1971 | 253 | 318 | 909 | 331 | 633 | 117 | 114 | 179 | 179 | 80.5 | 65 | 780 | 329.88 |
| 1972 | 863 | 563 | 419 | 179 | 254 | 72 | 71.5 | 65 | 52 | 58.5 | 87.5 | 973 | 304.79 |
| 1973 | 796 | 604 | 741 | 1250 | 705 | 184 | 101 | 106 | 101 | 77.5 | 149 | 524 | 444.88 |
| 1974 | 1380 | 1310 | 541 | 1170 | 321 | 218 | 99.5 | 90 | 150 | 95.5 | 140 | 433 | 495.67 |
| 1975 | 1040 | 628 | 762 | 550 | 848 | 297 | 147 | 473 | 129 | 294 | 243 | 207 | 468.17 |
| 1976 | 355 | 272 | 745 | 881 | 243 | 141 | 119 | 65 | 65 | 50 | 80 | 159 | 264.58 |
| 1977 | 566 | 211 | 932 | 956 | 147 | 60 | 70 | 95 | 127 | 146 | 279 | 596 | 348.75 |
| 1978 | 427 | 571 | 334 | 215 | 639 | 170 | 85 | 75 | 65 | 60 | 48 | 127 | 234.67 |
| 1979 | 722 | 1120 | 1090 | 1360 | 406 | 134 | 278 | 124 | 267 | 155 | 181 | 649 | 540.5 |
| 1980 | 631 | 771 | 848 | 1904 | 828 | 150 | 151 | 74.5 | 61.5 | 68.5 | 148 | 153 | 482.38 |
| 1981 | 90 | 250 | 299 | 444 | 116 | 98 | 132 | 55.5 | 60.5 | 51.5 | 46 | 85.5 | 144 |
| 1982 | 266 | 541 | 337 | 325 | 220 | 71.5 | 81 | 177 | 56.5 | 68 | 79 | 1134 | 279.67 |
| 1983 | 985 | 1298 | 918 | 1501 | 670 | 638 | 236 | 108 | 90.5 | 71.5 | 143 | 584 | 603.58 |
| 1984 | 533 | 574 | 664 | 399 | 287 | 79.5 | 92 | 128 | 66 | 286 | 187 | 371 | 305.54 |
| |
|
|
|
|
|
|
|
|
|
|
|
|
|
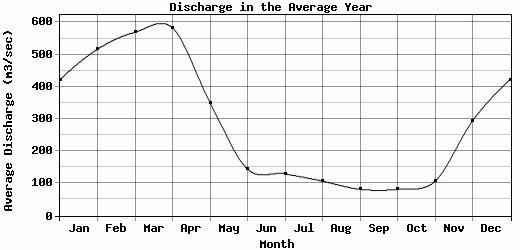
| Avg | 421.96 | 516.61 | 569.22 | 582.83 | 350.28 | 144.49 | 129.86 | 107.27 | 81.91 | 81.74 | 106.54 | 294.2 | 282.86 |
| |
|
|
|
|
|
|
|
|
|
|
|
|
|
| Std Dev | 319.62 |
297.82 |
255.05 |
394.79 |
233.99 |
105.63 |
114.27 |
70.95 |
43.7 |
60.89 |
90.12 |
288.53 |
115.73 |
| |
|
|
|
|
|
|
|
|
|
|
|
|
|
| | Jan | Feb | Mar | Apr | May | Jun | Jul | Aug | Sep | Oct | Nov | Dec | Avg Annual |
Click here for this table in tab-delimited format.
Tab-delimited format will open in most table browsing software, i.e. Excel, etc.
View this station on the map.
Return to start.