Results
| Country: | U.S.A.
| | Station: | BARSTOW (BARSTOW CANAL), TEX.(DISC) | | River: | PECOS R | | Area: | 56458.65 | | Lat: | 31.58 | | Lon: | -103.5 | | Source: | USGS | | PointID: | 8416500 | | Area Units: | km2 | | Discharge Units: | m3/sec | | Starting Year: | 1982 | | Ending Year: | 1993 | | Total Years: | 12 | | Total Usable Years: | 5 | |
| |
| Year | Jan | Feb | Mar | Apr | May | Jun | Jul | Aug | Sep | Oct | Nov | Dec | Avg Annual |
|---|
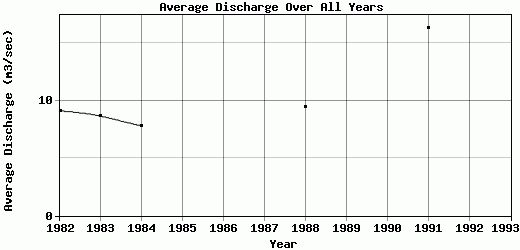
| 1982 | 9.17 | 6.98 | 10.4 | 14.91 | 26.48 | 15.25 | 12.14 | 2.72 | 1.66 | 2.68 | 3.93 | 2.84 | 9.1 |
| 1983 | 5.39 | 16.46 | 19.43 | 15.86 | 7.52 | 13.29 | 7.85 | 7.79 | 3.29 | 1.93 | 2.07 | 2.85 | 8.64 |
| 1984 | 4.43 | 2.57 | 4.93 | 1.21 | 3.84 | 15.09 | 12.51 | 8 | 4.09 | 11.23 | 14.42 | 11.15 | 7.79 |
| 1985 | -9999 | -9999 | -9999 | -9999 | -9999 | -9999 | -9999 | -9999 | -9999 | -9999 | -9999 | -9999 | -9999 |
| 1986 | -9999 | -9999 | -9999 | -9999 | -9999 | -9999 | -9999 | -9999 | -9999 | -9999 | -9999 | -9999 | -9999 |
| 1987 | -9999 | -9999 | -9999 | -9999 | -9999 | -9999 | -9999 | -9999 | -9999 | -9999 | -9999 | -9999 | -9999 |
| 1988 | 13.01 | 7.9 | 11.8 | 6.62 | 12.71 | 20.42 | 18.97 | 15.18 | 1.69 | 1.72 | 1.75 | 1.93 | 9.48 |
| 1989 | -9999 | -9999 | -9999 | -9999 | -9999 | -9999 | -9999 | -9999 | -9999 | -9999 | -9999 | -9999 | -9999 |
| 1990 | -9999 | -9999 | -9999 | -9999 | -9999 | -9999 | -9999 | -9999 | -9999 | -9999 | -9999 | -9999 | -9999 |
| 1991 | 8.86 | 22.32 | 18.25 | 15.62 | 21.34 | 19.49 | 12.18 | 7.37 | 18.98 | 7.3 | 22.01 | 22.02 | 16.31 |
| 1992 | -9999 | -9999 | -9999 | -9999 | -9999 | -9999 | -9999 | -9999 | -9999 | -9999 | -9999 | -9999 | -9999 |
| 1993 | -9999 | -9999 | -9999 | -9999 | -9999 | -9999 | -9999 | -9999 | -9999 | -9999 | -9999 | -9999 | -9999 |
| |
|
|
|
|
|
|
|
|
|
|
|
|
|
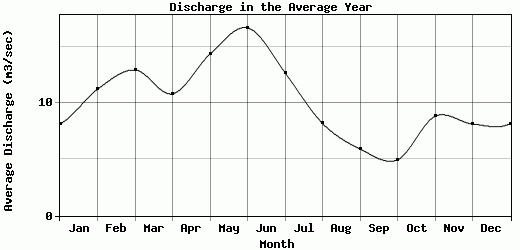
| Avg | 8.17 | 11.25 | 12.96 | 10.84 | 14.38 | 16.71 | 12.73 | 8.21 | 5.94 | 4.97 | 8.84 | 8.16 | 10.26 |
| |
|
|
|
|
|
|
|
|
|
|
|
|
|
| Std Dev | 3.05 |
7.13 |
5.33 |
5.92 |
8.44 |
2.75 |
3.56 |
3.99 |
6.59 |
3.73 |
8.06 |
7.7 |
3.08 |
| |
|
|
|
|
|
|
|
|
|
|
|
|
|
| | Jan | Feb | Mar | Apr | May | Jun | Jul | Aug | Sep | Oct | Nov | Dec | Avg Annual |
Click here for this table in tab-delimited format.
Tab-delimited format will open in most table browsing software, i.e. Excel, etc.
View this station on the map.
Return to start.