Results
| Country: | U.S.A.
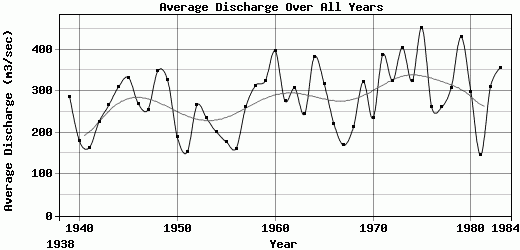
| | Station: | PeeDee, South Carolina | | River: | PeeDee | | Area: | 22870 km2 | | Lat: | 34.2 | | Lon: | -79.55 | | Source: | | | PointID: | 407 | | Area Units: | km2 | | Discharge Units: | m3/sec | | Starting Year: | 1938 | | Ending Year: | 1984 | | Total Years: | 47 | | Total Usable Years: | 46 | |
| |
| Year | Jan | Feb | Mar | Apr | May | Jun | Jul | Aug | Sep | Oct | Nov | Dec | Avg Annual |
|---|
| 1938 | -9999 | -9999 | -9999 | -9999 | -9999 | -9999 | -9999 | -9999 | -9999 | 124 | 128 | 177 | -9999 |
| 1939 | 229 | 708 | 789 | 276 | 181 | 158 | 228 | 361 | 175 | 127 | 96 | 90 | 284.83 |
| 1940 | 169 | 267 | 212 | 203 | 126 | 119 | 101 | 330 | 173 | 109 | 177 | 163 | 179.08 |
| 1941 | 183 | 157 | 216 | 284 | 131 | 129 | 349 | 147 | 98 | 92 | 72 | 108 | 163.83 |
| 1942 | 121 | 232 | 538 | 240 | 259 | 252 | 172 | 181 | 242 | 171 | 129 | 183 | 226.67 |
| 1943 | 401 | 557 | 467 | 387 | 233 | 172 | 469 | 140 | 98 | 76 | 75 | 120 | 266.25 |
| 1944 | 298 | 419 | 703 | 669 | 247 | 141 | 214 | 189 | 115 | 327 | 161 | 244 | 310.58 |
| 1945 | 265 | 363 | 351 | 202 | 185 | 131 | 161 | 197 | 1391 | 221 | 181 | 346 | 332.83 |
| 1946 | 715 | 542 | 278 | 233 | 309 | 197 | 212 | 206 | 113 | 160 | 131 | 142 | 269.83 |
| 1947 | 421 | 235 | 335 | 360 | 137 | 151 | 172 | 140 | 136 | 158 | 531 | 292 | 255.67 |
| 1948 | 302 | 812 | 536 | 517 | 217 | 216 | 160 | 179 | 129 | 163 | 305 | 643 | 348.25 |
| 1949 | 547 | 422 | 308 | 315 | 518 | 164 | 239 | 294 | 399 | 170 | 317 | 229 | 326.83 |
| 1950 | 223 | 212 | 275 | 202 | 280 | 210 | 182 | 133 | 152 | 130 | 131 | 139 | 189.08 |
| 1951 | 156 | 184 | 232 | 352 | 156 | 109 | 104 | 116 | 74 | 59 | 73 | 224 | 153.25 |
| 1952 | 230 | 386 | 814 | 370 | 243 | 162 | 82 | 194 | 358 | 105 | 120 | 124 | 265.67 |
| 1953 | 338 | 507 | 620 | 342 | 197 | 156 | 125 | 98 | 93 | 66 | 63 | 206 | 234.25 |
| 1954 | 496 | 329 | 313 | 379 | 162 | 107 | 107 | 56 | 39 | 120 | 106 | 201 | 201.25 |
| 1955 | 189 | 326 | 232 | 382 | 173 | 120 | 126 | 138 | 105 | 129 | 105 | 107 | 177.67 |
| 1956 | 92 | 268 | 316 | 231 | 227 | 95 | 98 | 89 | 103 | 133 | 125 | 162 | 161.58 |
| 1957 | 175 | 297 | 369 | 376 | 191 | 249 | 132 | 105 | 158 | 178 | 348 | 567 | 262.08 |
| 1958 | 408 | 441 | 430 | 633 | 697 | 240 | 243 | 165 | 137 | 127 | 105 | 138 | 313.67 |
| 1959 | 213 | 376 | 311 | 507 | 225 | 175 | 239 | 279 | 287 | 679 | 304 | 306 | 325.08 |
| 1960 | 470 | 1257 | 681 | 826 | 316 | 216 | 171 | 219 | 186 | 150 | 125 | 143 | 396.67 |
| 1961 | 164 | 351 | 645 | 585 | 308 | 241 | 223 | 207 | 199 | 76 | 97 | 224 | 276.67 |
| 1962 | 472 | 443 | 663 | 566 | 178 | 299 | 199 | 120 | 127 | 118 | 243 | 255 | 306.92 |
| 1963 | 421 | 419 | 775 | 256 | 183 | 156 | 113 | 106 | 85 | 92 | 116 | 206 | 244 |
| 1964 | 432 | 583 | 515 | 528 | 194 | 141 | 191 | 316 | 334 | 825 | 227 | 307 | 382.75 |
| 1965 | 388 | 528 | 778 | 479 | 231 | 302 | 297 | 233 | 152 | 148 | 154 | 129 | 318.25 |
| 1966 | 194 | 489 | 724 | 182 | 205 | 170 | 103 | 117 | 118 | 116 | 124 | 116 | 221.5 |
| 1967 | 214 | 276 | 221 | 122 | 128 | 98 | 102 | 246 | 181 | 97 | 105 | 246 | 169.67 |
| 1968 | 598 | 253 | 345 | 192 | 154 | 217 | 142 | 110 | 61.5 | 133 | 199 | 159 | 213.63 |
| 1969 | 216 | 547 | 499 | 388 | 166 | 234 | 151 | 219 | 130 | 158 | 975 | 186 | 322.42 |
| 1970 | 227 | 356 | 369 | 339 | 184 | 105 | 104 | 451 | 168 | 111 | 240 | 158 | 234.33 |
| 1971 | 335 | 585 | 684 | 323 | 494 | 243 | 187 | 307 | 162 | 512 | 463 | 357 | 387.67 |
| 1972 | 478 | 569 | 296 | 314 | 405 | 402 | 284 | 136 | 110 | 131 | 209 | 566 | 325 |
| 1973 | 474 | 915 | 647 | 894 | 338 | 404 | 292 | 249 | 152 | 127 | 131 | 237 | 405 |
| 1974 | 476 | 651 | 314 | 541 | 296 | 226 | 170 | 327 | 281 | 134 | 124 | 343 | 323.58 |
| 1975 | 632 | 656 | 950 | 557 | 396 | 410 | 609 | 201 | 285 | 286 | 231 | 217 | 452.5 |
| 1976 | 368 | 319 | 237 | 176 | 177 | 356 | 225 | 80 | 85 | 335 | 190 | 587 | 261.25 |
| 1977 | 436 | 188 | 552 | 516 | 123 | 108 | 85 | 103 | 198 | 183 | 349 | 288 | 260.75 |
| 1978 | 704 | 577 | 451 | 311 | 535 | 215 | 191 | 220 | 136 | 90 | 100 | 176 | 308.83 |
| 1979 | 424 | 459 | 1030 | 524 | 398 | 428 | 218 | 134 | 469 | 396 | 428 | 258 | 430.5 |
| 1980 | 485 | 410 | 641 | 761 | 328 | 167 | 134 | 112 | 105 | 141 | 153 | 142 | 298.25 |
| 1981 | 118 | 250 | 156 | 115 | 87 | 186 | 167 | 195 | 130 | 101 | 90.5 | 159 | 146.21 |
| 1982 | 601 | 575 | 450 | 204 | 274 | 508 | 196 | 159 | 81.5 | 143 | 160 | 365 | 309.71 |
| 1983 | 333 | 694 | 818 | 821 | 324 | 201 | 122 | 95.5 | 89 | 91 | 120 | 564 | 356.04 |
| 1984 | 585 | 560 | 779 | 900 | 407 | 325 | 386 | 346 | 149 | -9999 | -9999 | -9999 | -9999 |
| |
|
|
|
|
|
|
|
|
|
|
|
|
|
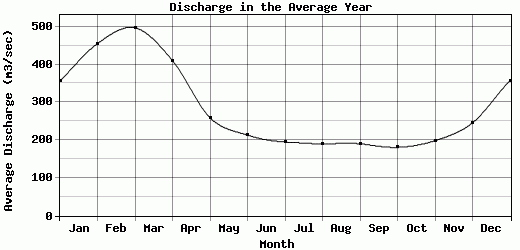
| Avg | 356.87 | 455.43 | 497.07 | 410.43 | 259.2 | 213.28 | 195.15 | 190.12 | 190.2 | 180.83 | 198.62 | 245.63 | 280.01 |
| |
|
|
|
|
|
|
|
|
|
|
|
|
|
| Std Dev | 163.08 |
208.64 |
222.29 |
204.11 |
124.76 |
97.64 |
100.96 |
87.04 |
200.17 |
149.9 |
157.28 |
138.21 |
76.07 |
| |
|
|
|
|
|
|
|
|
|
|
|
|
|
| | Jan | Feb | Mar | Apr | May | Jun | Jul | Aug | Sep | Oct | Nov | Dec | Avg Annual |
Click here for this table in tab-delimited format.
Tab-delimited format will open in most table browsing software, i.e. Excel, etc.
View this station on the map.
Return to start.