Results
| Country: | U.S.S.R.
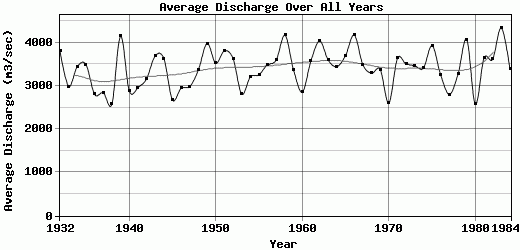
| | Station: | Ust- Tsilma | | River: | Petchora | | Area: | 248000 km2 | | Lat: | 65.47 | | Lon: | 52.25 | | Source: | RivDIS | | PointID: | 829 | | Area Units: | km2 | | Discharge Units: | m3/sec | | Starting Year: | 1932 | | Ending Year: | 1984 | | Total Years: | 53 | | Total Usable Years: | 53 | |
| |
| Year | Jan | Feb | Mar | Apr | May | Jun | Jul | Aug | Sep | Oct | Nov | Dec | Avg Annual |
|---|
| 1932 | 532 | 369 | 310 | 592 | 11600 | 14000 | 7610 | 2110 | 1530 | 4330 | 1550 | 1140 | 3806.08 |
| 1933 | 653 | 384 | 294 | 443 | 6090 | 10100 | 5740 | 2150 | 3480 | 3780 | 1510 | 1230 | 2987.83 |
| 1934 | 763 | 537 | 461 | 538 | 10400 | 18600 | 2590 | 1570 | 1380 | 1450 | 2120 | 967 | 3448 |
| 1935 | 561 | 381 | 318 | 347 | 3140 | 24300 | 4490 | 2040 | 1640 | 2980 | 928 | 833 | 3496.5 |
| 1936 | 568 | 424 | 363 | 413 | 6160 | 13900 | 2280 | 1380 | 1890 | 4080 | 1320 | 912 | 2807.5 |
| 1937 | 524 | 331 | 353 | 685 | 4900 | 15500 | 3920 | 1380 | 981 | 2400 | 2320 | 826 | 2843.33 |
| 1938 | 550 | 409 | 327 | 489 | 11000 | 6130 | 3790 | 1920 | 2030 | 2220 | 1210 | 921 | 2583 |
| 1939 | 553 | 410 | 316 | 478 | 4520 | 23700 | 5820 | 3840 | 5340 | 2880 | 1140 | 827 | 4152 |
| 1940 | 534 | 377 | 393 | 488 | 4410 | 15800 | 6770 | 1910 | 1280 | 1320 | 741 | 693 | 2893 |
| 1941 | 490 | 370 | 273 | 251 | 5720 | 16200 | 4570 | 1460 | 2302 | 2380 | 808 | 691 | 2959.58 |
| 1942 | 489 | 421 | 257 | 314 | 5150 | 17600 | 4360 | 2360 | 3660 | 1890 | 838 | 621 | 3163.33 |
| 1943 | 455 | 346 | 295 | 498 | 15700 | 9730 | 3670 | 1850 | 2470 | 5990 | 2070 | 1280 | 3696.17 |
| 1944 | 789 | 563 | 452 | 446 | 9590 | 11000 | 5450 | 3240 | 5660 | 3820 | 1820 | 803 | 3636.08 |
| 1945 | 533 | 421 | 358 | 371 | 2000 | 14500 | 3030 | 1770 | 2430 | 3860 | 1840 | 1040 | 2679.42 |
| 1946 | 766 | 582 | 425 | 426 | 10800 | 12400 | 5500 | 1600 | 1340 | 779 | 457 | 305 | 2948.33 |
| 1947 | 426 | 399 | 353 | 404 | 10400 | 12300 | 3450 | 2180 | 1870 | 2270 | 989 | 822 | 2988.58 |
| 1948 | 606 | 515 | 448 | 472 | 12300 | 8550 | 3660 | 3850 | 2110 | 3600 | 3220 | 1150 | 3373.42 |
| 1949 | 754 | 604 | 495 | 434 | 12400 | 11400 | 5930 | 3210 | 2760 | 5320 | 3160 | 1360 | 3985.58 |
| 1950 | 788 | 429 | 250 | 2410 | 13500 | 11800 | 3450 | 2540 | 2260 | 3060 | 1040 | 787 | 3526.17 |
| 1951 | 550 | 428 | 369 | 4390 | 8990 | 9500 | 5060 | 4420 | 4130 | 5170 | 1560 | 1200 | 3813.92 |
| 1952 | 864 | 684 | 556 | 484 | 2090 | 24100 | 2780 | 1680 | 4540 | 3560 | 1420 | 853 | 3634.25 |
| 1953 | 579 | 468 | 418 | 4000 | 10200 | 6300 | 2420 | 1290 | 3390 | 2620 | 1250 | 816 | 2812.58 |
| 1954 | 588 | 463 | 406 | 638 | 11000 | 11400 | 4810 | 1450 | 2610 | 2880 | 1280 | 990 | 3209.58 |
| 1955 | 712 | 580 | 681 | 878 | 15000 | 5700 | 2610 | 1890 | 3130 | 4500 | 2320 | 1150 | 3262.58 |
| 1956 | 774 | 625 | 497 | 488 | 8560 | 10300 | 4330 | 3190 | 5570 | 5460 | 1160 | 933 | 3490.58 |
| 1957 | 735 | 656 | 589 | 543 | 15000 | 9030 | 4960 | 1340 | 2570 | 3420 | 3010 | 1430 | 3606.92 |
| 1958 | 988 | 793 | 588 | 552 | 6790 | 23300 | 5740 | 2840 | 2460 | 3550 | 1520 | 966 | 4173.92 |
| 1959 | 760 | 593 | 566 | 531 | 11200 | 13100 | 4450 | 2010 | 2510 | 2670 | 1150 | 814 | 3362.83 |
| 1960 | 663 | 540 | 461 | 633 | 7270 | 14800 | 3690 | 1340 | 1360 | 1580 | 1090 | 843 | 2855.83 |
| 1961 | 655 | 541 | 490 | 537 | 6280 | 19900 | 4990 | 1520 | 1950 | 2670 | 2470 | 928 | 3577.58 |
| 1962 | 688 | 579 | 555 | 1580 | 18400 | 8790 | 3670 | 3080 | 3550 | 4080 | 2250 | 1280 | 4041.83 |
| 1963 | 911 | 702 | 562 | 544 | 12100 | 11900 | 4430 | 2830 | 3020 | 3450 | 1450 | 1260 | 3596.58 |
| 1964 | 755 | 616 | 565 | 508 | 8580 | 15500 | 2960 | 1940 | 3380 | 3980 | 1600 | 1010 | 3449.5 |
| 1965 | 696 | 584 | 464 | 480 | 8050 | 11500 | 6550 | 4950 | 4720 | 4060 | 1380 | 1050 | 3707 |
| 1966 | 783 | 658 | 515 | 592 | 9860 | 18400 | 3150 | 2350 | 5750 | 4980 | 1800 | 1310 | 4179 |
| 1967 | 735 | 621 | 549 | 1500 | 15400 | 8670 | 3780 | 1270 | 1160 | 3130 | 4000 | 1100 | 3492.92 |
| 1968 | 887 | 627 | 510 | 547 | 10600 | 11600 | 4610 | 3090 | 2940 | 2240 | 1080 | 811 | 3295.17 |
| 1969 | 607 | 479 | 438 | 431 | 2200 | 14500 | 10200 | 3040 | 5170 | 1780 | 925 | 809 | 3381.58 |
| 1970 | 548 | 458 | 442 | 499 | 2260 | 15300 | 3740 | 1720 | 1480 | 2010 | 1770 | 1000 | 2602.25 |
| 1971 | 776 | 599 | 566 | 566 | 2340 | 18400 | 8470 | 2890 | 4120 | 2250 | 1470 | 1250 | 3641.42 |
| 1972 | 847 | 722 | 620 | 615 | 1790 | 21200 | 7900 | 2000 | 2330 | 1960 | 1150 | 993 | 3510.58 |
| 1973 | 778 | 703 | 689 | 1390 | 13900 | 13700 | 2540 | 1620 | 2250 | 1540 | 1400 | 1050 | 3463.33 |
| 1974 | 822 | 706 | 638 | 664 | 6570 | 19200 | 4030 | 1500 | 2610 | 2320 | 1050 | 873 | 3415.25 |
| 1975 | 721 | 669 | 571 | 1190 | 8900 | 12600 | 9590 | 2880 | 3560 | 3560 | 1630 | 1340 | 3934.25 |
| 1976 | 965 | 735 | 614 | 665 | 10400 | 13400 | 4020 | 1290 | 3050 | 1760 | 1100 | 978 | 3248.08 |
| 1977 | 789 | 601 | 498 | 636 | 13700 | 7410 | 1950 | 1150 | 2290 | 2130 | 1210 | 1280 | 2803.67 |
| 1978 | 773 | 664 | 583 | 649 | 2560 | 14200 | 11800 | 2580 | 1690 | 1770 | 1090 | 950 | 3275.75 |
| 1979 | 815 | 737 | 611 | 613 | 13100 | 11000 | 5340 | 5170 | 5520 | 3500 | 1320 | 1200 | 4077.17 |
| 1980 | 802 | 711 | 662 | 865 | 7470 | 9490 | 3190 | 1280 | 1960 | 2290 | 1070 | 1120 | 2575.83 |
| 1981 | 842 | 663 | 577 | 524 | 5620 | 20300 | 4780 | 1970 | 2720 | 2800 | 1990 | 903 | 3640.75 |
| 1982 | 807 | 581 | 496 | 644 | 17400 | 7000 | 4660 | 2480 | 4580 | 1940 | 1500 | 1340 | 3619 |
| 1983 | 946 | 832 | 712 | 1680 | 10500 | 16000 | 4950 | 3280 | 4670 | 5140 | 2160 | 1280 | 4345.83 |
| 1984 | 1000 | 768 | 684 | 609 | 9770 | 14300 | 5470 | 1770 | 3360 | 1400 | 906 | 590 | 3385.58 |
| |
|
|
|
|
|
|
|
|
|
|
|
|
|
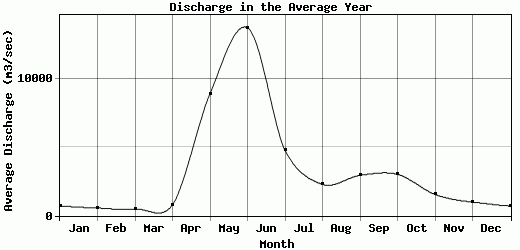
| Avg | 707.45 | 559.58 | 480.81 | 795.55 | 8936.42 | 13760.4 | 4786.79 | 2291.7 | 2953.08 | 3029.42 | 1558.72 | 998.26 | 3404.85 |
| |
|
|
|
|
|
|
|
|
|
|
|
|
|
| Std Dev | 143.29 |
130.63 |
123.71 |
776.29 |
4267.66 |
4704.64 |
1992.96 |
940.34 |
1301.71 |
1204.83 |
682.69 |
227.53 |
444.05 |
| |
|
|
|
|
|
|
|
|
|
|
|
|
|
| | Jan | Feb | Mar | Apr | May | Jun | Jul | Aug | Sep | Oct | Nov | Dec | Avg Annual |
Click here for this table in tab-delimited format.
Tab-delimited format will open in most table browsing software, i.e. Excel, etc.
View this station on the map.
Return to start.