Results
| Country: | Italy
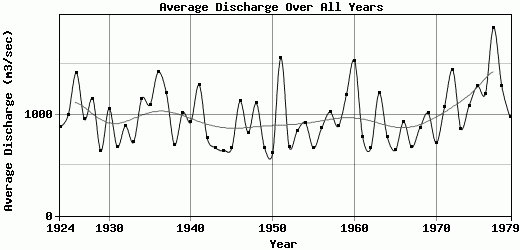
| | Station: | Piacenza | | River: | Po | | Area: | 42030 km2 | | Lat: | 45.08 | | Lon: | 9.73 | | Source: | RivDIS | | PointID: | 743 | | Area Units: | km2 | | Discharge Units: | m3/sec | | Starting Year: | 1924 | | Ending Year: | 1979 | | Total Years: | 56 | | Total Usable Years: | 56 | |
| |
| Year | Jan | Feb | Mar | Apr | May | Jun | Jul | Aug | Sep | Oct | Nov | Dec | Avg Annual |
|---|
| 1924 | 502 | 531 | 564 | 900 | 918 | 1100 | 669 | 946 | 857 | 1760 | 766 | 1040 | 879.42 |
| 1925 | 484 | 1010 | 1180 | 1220 | 1560 | 1470 | 1110 | 718 | 916 | 958 | 766 | 535 | 993.92 |
| 1926 | 500 | 1250 | 678 | 913 | 2790 | 1570 | 1270 | 581 | 532 | 592 | 4780 | 1540 | 1416.33 |
| 1927 | 922 | 625 | 1200 | 768 | 1160 | 1270 | 974 | 624 | 837 | 723 | 988 | 1360 | 954.25 |
| 1928 | 734 | 570 | 1000 | 1860 | 1670 | 1470 | 652 | 413 | 692 | 1300 | 2900 | 682 | 1161.92 |
| 1929 | 528 | 435 | 569 | 481 | 1050 | 924 | 470 | 643 | 466 | 800 | 637 | 710 | 642.75 |
| 1930 | 761 | 820 | 1020 | 1310 | 2080 | 1970 | 1230 | 636 | 918 | 762 | 471 | 774 | 1062.67 |
| 1931 | 440 | 496 | 576 | 452 | 1270 | 879 | 506 | 524 | 604 | 553 | 1330 | 557 | 682.25 |
| 1932 | 416 | 386 | 523 | 554 | 1440 | 1440 | 1780 | 584 | 644 | 1230 | 625 | 1050 | 889.33 |
| 1933 | 533 | 637 | 760 | 445 | 575 | 812 | 541 | 310 | 582 | 992 | 1720 | 820 | 727.25 |
| 1934 | 657 | 532 | 1370 | 1630 | 2410 | 1200 | 710 | 944 | 881 | 513 | 1945 | 1150 | 1161.83 |
| 1935 | 585 | 609 | 607 | 466 | 1050 | 1390 | 645 | 923 | 866 | 2060 | 2600 | 1370 | 1097.58 |
| 1936 | 1660 | 1180 | 1960 | 1930 | 2530 | 2360 | 1730 | 780 | 1120 | 694 | 569 | 559 | 1422.67 |
| 1937 | 458 | 640 | 1300 | 1370 | 1540 | 1770 | 753 | 574 | 1370 | 1830 | 2240 | 764 | 1217.42 |
| 1938 | 512 | 458 | 467 | 230 | 460 | 1110 | 702 | 482 | 1240 | 1260 | 687 | 853 | 705.08 |
| 1939 | 996 | 806 | 673 | 703 | 1730 | 1440 | 1110 | 1260 | 1090 | 879 | 911 | 645 | 1020.25 |
| 1940 | 502 | 555 | 540 | 429 | 1480 | 1790 | 1740 | 604 | 533 | 1260 | 1090 | 608 | 927.58 |
| 1941 | 714 | 1210 | 1180 | 2100 | 1930 | 2800 | 1430 | 653 | 511 | 1290 | 1160 | 597 | 1297.92 |
| 1942 | 446 | 431 | 904 | 630 | 962 | 637 | 463 | 386 | 745 | 1270 | 1610 | 734 | 768.17 |
| 1943 | 614 | 667 | 633 | 581 | 1140 | 405 | 296 | 292 | 733 | 967 | 741 | 1010 | 673.25 |
| 1944 | 500 | 396 | 482 | 423 | 318 | 292 | 693 | 526 | 619 | 1780 | 1130 | 587 | 645.5 |
| 1945 | 410 | 533 | 574 | 433 | 320 | 491 | 266 | 584 | 583 | 480 | 2280 | 1070 | 668.67 |
| 1946 | 592 | 730 | 2060 | 1100 | 2440 | 2230 | 1210 | 701 | 1130 | 507 | 487 | 424 | 1134.25 |
| 1947 | 382 | 461 | 1090 | 1020 | 1170 | 626 | 479 | 393 | 1020 | 1230 | 1010 | 1000 | 823.42 |
| 1948 | 1080 | 976 | 677 | 1000 | 3100 | 1370 | 436 | 723 | 1960 | 840 | 713 | 490 | 1113.75 |
| 1949 | 629 | 439 | 482 | 321 | 2200 | 1200 | 435 | 238 | 434 | 436 | 705 | 562 | 673.42 |
| 1950 | 418 | 654 | 659 | 842 | 1210 | 825 | 279 | 326 | 549 | 487 | 527 | 691 | 622.25 |
| 1951 | 849 | 1790 | 1280 | 906 | 1970 | 2160 | 1390 | 1160 | 826 | 1060 | 4240 | 1120 | 1562.58 |
| 1952 | 636 | 557 | 544 | 824 | 1480 | 802 | 499 | 519 | 666 | 675 | 532 | 485 | 684.92 |
| 1953 | 444 | 410 | 428 | 426 | 438 | 1120 | 1030 | 436 | 690 | 2530 | 1410 | 715 | 839.75 |
| 1954 | 579 | 715 | 1100 | 958 | 1540 | 1500 | 689 | 964 | 777 | 507 | 540 | 1170 | 919.92 |
| 1955 | 966 | 992 | 953 | 588 | 390 | 1010 | 576 | 385 | 589 | 571 | 519 | 482 | 668.42 |
| 1956 | 528 | 394 | 1140 | 1720 | 986 | 852 | 949 | 472 | 1350 | 812 | 803 | 460 | 872.17 |
| 1957 | 466 | 671 | 677 | 1100 | 1520 | 3010 | 976 | 530 | 474 | 500 | 1300 | 1130 | 1029.5 |
| 1958 | 626 | 668 | 636 | 1210 | 939 | 980 | 665 | 620 | 543 | 1130 | 1180 | 1420 | 884.75 |
| 1959 | 706 | 626 | 1240 | 1310 | 1980 | 1300 | 722 | 719 | 699 | 1120 | 1430 | 2460 | 1192.67 |
| 1960 | 1120 | 1230 | 1450 | 1320 | 1510 | 1500 | 1100 | 948 | 1580 | 2820 | 2200 | 1680 | 1538.17 |
| 1961 | 991 | 778 | 714 | 1040 | 839 | 1130 | 690 | 379 | 391 | 615 | 1040 | 721 | 777.33 |
| 1962 | 627 | 504 | 819 | 955 | 925 | 912 | 394 | 262 | 318 | 416 | 1360 | 522 | 667.83 |
| 1963 | 657 | 521 | 935 | 1790 | 1370 | 1690 | 1100 | 917 | 1600 | 943 | 2080 | 967 | 1214.17 |
| 1964 | 596 | 661 | 1290 | 1860 | 998 | 1150 | 492 | 394 | 413 | 499 | 513 | 529 | 782.92 |
| 1965 | 490 | 462 | 612 | 358 | 220 | 496 | 292 | 613 | 1570 | 1550 | 613 | 495 | 647.58 |
| 1966 | 413 | 963 | 767 | 887 | 928 | 566 | 565 | 493 | 553 | 2340 | 1940 | 742 | 929.75 |
| 1967 | 531 | 585 | 1010 | 659 | 772 | 630 | 496 | 654 | 886 | 626 | 801 | 478 | 677.33 |
| 1968 | 372 | 848 | 575 | 486 | 1060 | 1310 | 537 | 570 | 1160 | 592 | 2000 | 951 | 871.75 |
| 1969 | 682 | 864 | 1530 | 1290 | 2160 | 1460 | 1010 | 638 | 960 | 625 | 543 | 446 | 1017.33 |
| 1970 | 802 | 660 | 865 | 534 | 869 | 1030 | 475 | 452 | 680 | 915 | 791 | 550 | 718.58 |
| 1971 | 748 | 1100 | 1580 | 1440 | 2500 | 2270 | 757 | 543 | 522 | 453 | 553 | 471 | 1078.08 |
| 1972 | 797 | 2200 | 2730 | 1730 | 1530 | 2320 | 1180 | 729 | 1580 | 1070 | 748 | 724 | 1444.83 |
| 1973 | 1050 | 685 | 596 | 422 | 889 | 1590 | 1200 | 437 | 1040 | 1140 | 540 | 781 | 864.17 |
| 1974 | 835 | 2130 | 1740 | 1700 | 2030 | 1190 | 691 | 404 | 714 | 592 | 570 | 475 | 1089.25 |
| 1975 | 729 | 687 | 1260 | 951 | 2500 | 1920 | 782 | 642 | 1790 | 1330 | 1660 | 1160 | 1284.25 |
| 1976 | 607 | 871 | 709 | 595 | 840 | 462 | 391 | 496 | 1430 | 3740 | 3420 | 944 | 1208.75 |
| 1977 | 1390 | 1450 | 2050 | 1280 | 3780 | 2230 | 1590 | 2200 | 1950 | 2520 | 946 | 964 | 1862.5 |
| 1978 | 1380 | 1250 | 2070 | 1450 | 2560 | 2200 | 1080 | 1090 | 583 | 688 | 501 | 547 | 1283.25 |
| 1979 | 609 | 935 | 1380 | 776 | 732 | 982 | 490 | 641 | 618 | 2440 | 1240 | 877 | 976.67 |
| |
|
|
|
|
|
|
|
|
|
|
|
|
|
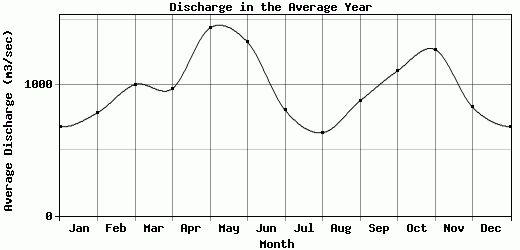
| Avg | 682.16 | 790.07 | 1007.29 | 976.36 | 1442.11 | 1332.38 | 810.48 | 637.05 | 881.86 | 1112 | 1275.02 | 833 | 981.65 |
| |
|
|
|
|
|
|
|
|
|
|
|
|
|
| Std Dev | 266.98 |
393.61 |
496.07 |
485.49 |
757.31 |
611.72 |
390.47 |
305.94 |
408.39 |
696.71 |
918.6 |
374.3 |
278.5 |
| |
|
|
|
|
|
|
|
|
|
|
|
|
|
| | Jan | Feb | Mar | Apr | May | Jun | Jul | Aug | Sep | Oct | Nov | Dec | Avg Annual |
Click here for this table in tab-delimited format.
Tab-delimited format will open in most table browsing software, i.e. Excel, etc.
View this station on the map.
Return to start.