Results
| Country: | U.S.A.
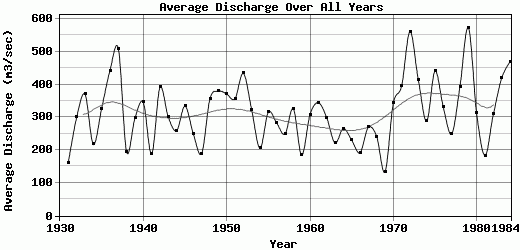
| | Station: | Washington,D.C. | | River: | Potomac | | Area: | 29940 km2 | | Lat: | 38.96 | | Lon: | -77.15 | | Source: | RivDIS | | PointID: | 411 | | Area Units: | km2 | | Discharge Units: | m3/sec | | Starting Year: | 1930 | | Ending Year: | 1984 | | Total Years: | 55 | | Total Usable Years: | 54 | |
| |
| Year | Jan | Feb | Mar | Apr | May | Jun | Jul | Aug | Sep | Oct | Nov | Dec | Avg Annual |
|---|
| 1930 | -9999 | -9999 | 370 | 260 | 111 | 81 | 36 | 16 | 19 | 16 | 19 | 48 | -9999 |
| 1931 | 84 | 103 | 184 | 450 | 407 | 184 | 180 | 126 | 71 | 39 | 26 | 76 | 160.83 |
| 1932 | 191 | 336 | 475 | 498 | 787 | 114 | 88 | 33 | 28 | 211 | 594 | 238 | 299.42 |
| 1933 | 441 | 416 | 705 | 1030 | 642 | 170 | 152 | 379 | 224 | 101 | 76 | 106 | 370.17 |
| 1934 | 270 | 84 | 356 | 387 | 178 | 113 | 54 | 100 | 261 | 162 | 96 | 549 | 217.5 |
| 1935 | 452 | 711 | 514 | 737 | 367 | 147 | 112 | 125 | 250 | 62 | 204 | 241 | 326.83 |
| 1936 | 679 | 685 | 2166 | 670 | 181 | 122 | 90 | 89 | 49 | 150 | 83 | 347 | 442.58 |
| 1937 | 1053 | 823 | 391 | 1030 | 453 | 225 | 144 | 313 | 189 | 769 | 481 | 245 | 509.67 |
| 1938 | 237 | 272 | 337 | 259 | 284 | 163 | 156 | 152 | 69 | 49 | 72 | 278 | 194 |
| 1939 | 226 | 1041 | 594 | 537 | 242 | 160 | 189 | 167 | 56 | 110 | 155 | 95 | 297.67 |
| 1940 | 98 | 419 | 475 | 920 | 302 | 514 | 136 | 207 | 247 | 111 | 338 | 376 | 345.25 |
| 1941 | 358 | 237 | 377 | 469 | 117 | 213 | 206 | 68 | 49 | 22 | 40 | 106 | 188.5 |
| 1942 | 115 | 211 | 389 | 486 | 583 | 239 | 117 | 396 | 132 | 1248 | 290 | 487 | 391.08 |
| 1943 | 608 | 756 | 660 | 530 | 430 | 190 | 132 | 58 | 41 | 44 | 109 | 43 | 300.08 |
| 1944 | 221 | 237 | 864 | 509 | 490 | 139 | 51 | 32 | 70 | 165 | 79 | 252 | 259.08 |
| 1945 | 286 | 474 | 615 | 305 | 332 | 174 | 166 | 267 | 564 | 157 | 227 | 445 | 334.33 |
| 1946 | 493 | 349 | 490 | 257 | 435 | 422 | 116 | 121 | 63 | 98 | 74 | 73 | 249.25 |
| 1947 | 352 | 194 | 355 | 203 | 299 | 201 | 177 | 119 | 64 | 40 | 168 | 100 | 189.33 |
| 1948 | 251 | 387 | 500 | 626 | 497 | 222 | 143 | 183 | 82 | 260 | 312 | 819 | 356.83 |
| 1949 | 929 | 690 | 354 | 431 | 323 | 390 | 595 | 220 | 145 | 77 | 159 | 246 | 379.92 |
| 1950 | 244 | 739 | 545 | 281 | 481 | 294 | 119 | 62 | 286 | 185 | 342 | 874 | 371 |
| 1951 | 458 | 924 | 596 | 765 | 372 | 540 | 158 | 79 | 50 | 42 | 82 | 209 | 356.25 |
| 1952 | 719 | 525 | 757 | 982 | 734 | 213 | 151 | 98 | 175 | 61 | 409 | 384 | 434 |
| 1953 | 755 | 486 | 905 | 543 | 498 | 272 | 93 | 75 | 48 | 34 | 50 | 115 | 322.83 |
| 1954 | 116 | 128 | 554 | 242 | 235 | 164 | 60 | 62 | 49 | 306 | 237 | 313 | 205.5 |
| 1955 | 332 | 352 | 904 | 341 | 203 | 332 | 81 | 798 | 147 | 125 | 98 | 70 | 315.25 |
| 1956 | 71 | 648 | 581 | 513 | 215 | 174 | 259 | 176 | 80 | 126 | 236 | 315 | 282.83 |
| 1957 | 299 | 640 | 447 | 587 | 227 | 172 | 57 | 32 | 39 | 66 | 75 | 341 | 248.5 |
| 1958 | 401 | 332 | 820 | 834 | 735 | 176 | 183 | 194 | 69 | 51 | 57 | 63 | 326.25 |
| 1959 | 151 | 192 | 253 | 365 | 306 | 256 | 60 | 63 | 37 | 176 | 106 | 246 | 184.25 |
| 1960 | 347 | 445 | 459 | 932 | 617 | 395 | 114 | 99 | 111 | 61 | 63 | 50 | 307.75 |
| 1961 | 140 | 882 | 855 | 970 | 466 | 212 | 100 | 75 | 67 | 72 | 85 | 211 | 344.58 |
| 1962 | 286 | 345 | 1299 | 672 | 280 | 187 | 82 | 48 | 39 | 46 | 187 | 118 | 299.08 |
| 1963 | 295 | 161 | 1275 | 238 | 141 | 198 | 56 | 37 | 30 | 25 | 76 | 127 | 221.58 |
| 1964 | 523 | 350 | 868 | 517 | 442 | 82 | 65 | 33 | 22 | 68 | 56 | 160 | 265.5 |
| 1965 | 423 | 556 | 806 | 477 | 227 | 73 | 40 | 31 | 28 | 45 | 31 | 29 | 230.5 |
| 1966 | 48 | 384 | 353 | 334 | 396 | 73 | 20 | 15 | 162 | 186 | 108 | 226 | 192.08 |
| 1967 | 274 | 307 | 1017 | 258 | 489 | 131 | 127 | 208 | 80 | 46 | 169 | 121 | 268.92 |
| 1968 | 343 | 452 | 676 | 232 | 355 | 315 | 76.5 | 54 | 58.5 | 46.5 | 167 | 120 | 241.29 |
| 1969 | 110 | 188 | 235 | 198 | 110 | 62 | 68.6 | 224 | 12 | 65 | 102 | 223 | 133.13 |
| 1970 | 328 | 599 | 451 | 968 | 258 | 174 | 241 | 100 | 45.6 | 54 | 457 | 434 | 342.47 |
| 1971 | 507 | 965 | 599 | 301 | 430 | 426 | 86 | 161 | 202 | 363 | 239 | 472 | 395.92 |
| 1972 | 267 | 726 | 769 | 694 | 700 | 1300 | 200 | 168 | 78 | 301 | 532 | 1000 | 561.25 |
| 1973 | 468 | 688 | 490 | 995 | 536 | 354 | 154 | 153 | 111 | 156 | 199 | 665 | 414.08 |
| 1974 | 712 | 310 | 317 | 594 | 285 | 380 | 127 | 71.5 | 102 | 55.5 | 61 | 439 | 287.83 |
| 1975 | 409 | 583 | 853 | 430 | 559 | 315 | 245 | 127 | 717 | 516 | 314 | 225 | 441.08 |
| 1976 | 688 | 433 | 310 | 346 | 137 | 174 | 102 | 75 | 60 | 1030 | 321 | 293 | 330.75 |
| 1977 | 104 | 171 | 666 | 644 | 132 | 70 | 55 | 40 | 29 | 65 | 404 | 611 | 249.25 |
| 1978 | 684 | 303 | 1200 | 452 | 862 | 179 | 243 | 303 | 95 | 50 | 60 | 296 | 393.92 |
| 1979 | 857 | 845 | 1060 | 515 | 473 | 395 | 153 | 152 | 598 | 945 | 511 | 369 | 572.75 |
| 1980 | 520 | 227 | 660 | 876 | 716 | 224 | 121 | 96 | 47 | 48 | 105 | 100 | 311.67 |
| 1981 | 47.5 | 387 | 214 | 371 | 283 | 365 | 129 | 53 | 74.5 | 67 | 89 | 114 | 182.83 |
| 1982 | 217 | 783 | 822 | 378 | 226 | 625 | 164 | 104 | 55 | 59 | 82 | 190 | 308.75 |
| 1983 | 124 | 448 | 715 | 1366 | 695 | 314 | 102 | 54 | 41.5 | 139 | 280 | 754 | 419.38 |
| 1984 | 296 | 1117 | 974 | 1354 | 564 | 154 | 188 | 321 | 92 | 90 | 141 | 337 | 469 |
| |
|
|
|
|
|
|
|
|
|
|
|
|
|
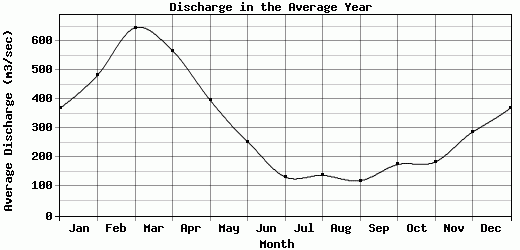
| Avg | 368.66 | 482.33 | 645.02 | 566.53 | 397.18 | 253.69 | 133.09 | 138.41 | 120.18 | 175.67 | 184.24 | 286.98 | 315.64 |
| |
|
|
|
|
|
|
|
|
|
|
|
|
|
| Std Dev | 234.22 |
255.99 |
337 |
286.41 |
191.58 |
188.81 |
84.77 |
127.74 |
139.46 |
252.59 |
144.75 |
220.64 |
97.28 |
| |
|
|
|
|
|
|
|
|
|
|
|
|
|
| | Jan | Feb | Mar | Apr | May | Jun | Jul | Aug | Sep | Oct | Nov | Dec | Avg Annual |
Click here for this table in tab-delimited format.
Tab-delimited format will open in most table browsing software, i.e. Excel, etc.
View this station on the map.
Return to start.