Results
| Country: | U.S.A.
| | Station: | MIZPAH, MT. | | River: | POWDER RIVER | | Area: | 26132092.36 | | Lat: | 46.25 | | Lon: | -105.27 | | Source: | USGS | | PointID: | 6326000 | | Area Units: | km2 | | Discharge Units: | m3/sec | | Starting Year: | 1905 | | Ending Year: | 1933 | | Total Years: | 29 | | Total Usable Years: | 24 | |
| |
| Year | Jan | Feb | Mar | Apr | May | Jun | Jul | Aug | Sep | Oct | Nov | Dec | Avg Annual |
|---|
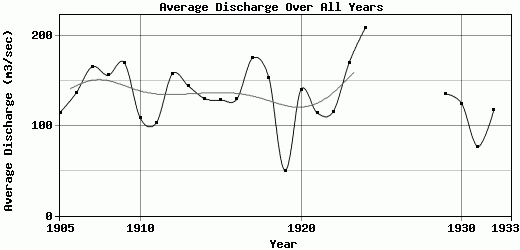
| 1905 | 42.48 | 45.31 | 62.31 | 40.78 | 122.31 | 493.09 | 258.98 | 98.72 | 56.65 | 61.7 | 48.2 | 45.31 | 114.65 |
| 1906 | 38.23 | 46.72 | 99.05 | 107.6 | 246.96 | 384.67 | 311.62 | 178.21 | 86.98 | 46.56 | 43.89 | 42.48 | 136.08 |
| 1907 | 28.32 | 41.06 | 48.14 | 67.27 | 245.12 | 472.14 | 631.65 | 220.01 | 82.08 | 60.78 | 48.22 | 42.48 | 165.61 |
| 1908 | 36.81 | 42.48 | 56.71 | 77.48 | 159.09 | 638.93 | 414.38 | 176.41 | 78.56 | 80.57 | 54.54 | 56.63 | 156.05 |
| 1909 | 46.72 | 50.97 | 163.82 | 59.87 | 124.9 | 629.2 | 481.95 | 153.98 | 129.81 | 63.62 | 67.22 | 70.79 | 170.24 |
| 1910 | 48.14 | 50.97 | 118.94 | 120.29 | 253.25 | 248.26 | 158.6 | 97.79 | 58.64 | 47.65 | 49.95 | 46.72 | 108.27 |
| 1911 | 28.32 | 33.98 | 47.74 | 51.66 | 102.08 | 394.84 | 240.75 | 140.89 | 83.71 | 53.84 | 34.35 | 28.32 | 103.37 |
| 1912 | 28.32 | 42.48 | 56.63 | 99.82 | 152.79 | 511.59 | 338.66 | 183.1 | 144.84 | 150.72 | 113.27 | 70.79 | 157.75 |
| 1913 | 56.63 | 45.31 | 84.95 | 199.65 | 218.74 | 419.75 | 301.24 | 147.18 | 79.51 | 67.4 | 56.63 | 50.97 | 144 |
| 1914 | 42.48 | 48.14 | 62.3 | 95.74 | 291.93 | 485.92 | 209.18 | 92.88 | 53.58 | 74.24 | 63.29 | 42.38 | 130.17 |
| 1915 | 48.14 | 56.63 | 67.96 | 63.58 | 99.41 | 424.42 | 248.82 | 113.51 | 152.37 | 129.61 | 77.02 | 62.3 | 128.65 |
| 1916 | 33.98 | 50.97 | 84.95 | 80.62 | 145.79 | 453.51 | 351.2 | 120.79 | 63.23 | 66.88 | 60.18 | 41.1 | 129.43 |
| 1917 | 32.66 | 54.15 | 193.27 | 143.01 | 202.58 | 544.41 | 515.73 | 129.14 | 94.69 | 61.07 | 59.99 | 72.35 | 175.25 |
| 1918 | 77.01 | 55.47 | 161 | 89.6 | 156.65 | 628.12 | 302.02 | 101.83 | 80.21 | 79.16 | 61.69 | 45.18 | 153.16 |
| 1919 | 50.57 | 44.96 | 56.46 | 54.26 | 86.7 | 71.71 | 17.2 | 31.58 | 36.07 | 57 | 52.27 | 42.24 | 50.09 |
| 1920 | 44.08 | 57.37 | 152.93 | 92.77 | 198.8 | 479.27 | 321.96 | 90.75 | 43.46 | 58.67 | 70.26 | 72.78 | 140.26 |
| 1921 | 57.16 | 65.36 | 73.23 | 49.12 | 169.18 | 570.97 | 142.45 | 52.4 | 43.25 | 42.17 | 55.22 | 50.46 | 114.25 |
| 1922 | 49.89 | 39 | 70.68 | 88.74 | 151.35 | 481.86 | 182.58 | 91.89 | 81.53 | 52.22 | 55.64 | 42.02 | 115.62 |
| 1923 | 37.91 | 33.98 | 99.72 | 90.44 | 184.79 | 425.64 | 381.59 | 141.13 | 145.76 | 268.87 | 138.58 | 96.27 | 170.39 |
| 1924 | 42.49 | 54.67 | 75.31 | 389.86 | 446.69 | 703.96 | 350.71 | 84.9 | 76.36 | 113.22 | 103.38 | 64.76 | 208.86 |
| 1925 | -9999 | -9999 | -9999 | -9999 | -9999 | -9999 | -9999 | -9999 | -9999 | -9999 | -9999 | -9999 | -9999 |
| 1926 | -9999 | -9999 | -9999 | -9999 | -9999 | -9999 | -9999 | -9999 | -9999 | -9999 | -9999 | -9999 | -9999 |
| 1927 | -9999 | -9999 | -9999 | -9999 | -9999 | -9999 | -9999 | -9999 | -9999 | -9999 | -9999 | -9999 | -9999 |
| 1928 | -9999 | -9999 | -9999 | -9999 | -9999 | -9999 | -9999 | -9999 | -9999 | -9999 | -9999 | -9999 | -9999 |
| 1929 | 40.34 | 41.99 | 302.18 | 95.01 | 210.83 | 396.35 | 177.55 | 67.3 | 79.64 | 77 | 66.69 | 71.29 | 135.51 |
| 1930 | 29.96 | 58.96 | 76.75 | 90.07 | 131.03 | 323.56 | 177.45 | 252.52 | 90.99 | 110.03 | 93.41 | 58.59 | 124.44 |
| 1931 | 54.9 | 50.98 | 53.7 | 54.36 | 162.23 | 280.08 | 34.87 | 63.45 | 36.74 | 54.5 | 43.12 | 32.12 | 76.75 |
| 1932 | 26.64 | 27.36 | 57.63 | 64.17 | 294.36 | 464 | 200.61 | 50.87 | 80.58 | 53.73 | 51.31 | 36.94 | 117.35 |
| 1933 | -9999 | -9999 | -9999 | -9999 | -9999 | -9999 | -9999 | -9999 | -9999 | -9999 | -9999 | -9999 | -9999 |
| |
|
|
|
|
|
|
|
|
|
|
|
|
|
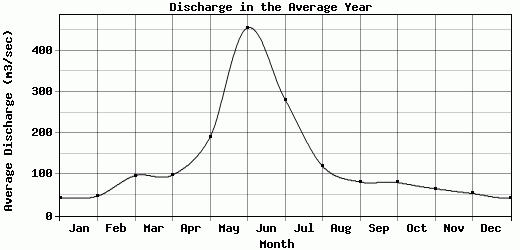
| Avg | 42.59 | 47.47 | 96.93 | 98.57 | 189.9 | 455.26 | 281.32 | 120.05 | 81.64 | 80.47 | 65.35 | 53.55 | 134.42 |
| |
|
|
|
|
|
|
|
|
|
|
|
|
|
| Std Dev | 11.58 |
8.71 |
58.58 |
69.38 |
77.99 |
135.01 |
140.41 |
53.64 |
32.32 |
47.53 |
23.83 |
15.88 |
32.89 |
| |
|
|
|
|
|
|
|
|
|
|
|
|
|
| | Jan | Feb | Mar | Apr | May | Jun | Jul | Aug | Sep | Oct | Nov | Dec | Avg Annual |
Click here for this table in tab-delimited format.
Tab-delimited format will open in most table browsing software, i.e. Excel, etc.
View this station on the map.
Return to start.