Results
| Country: | U.S.A.
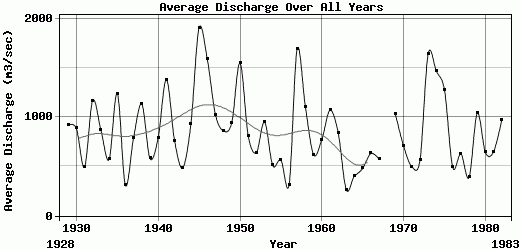
| | Station: | Alexandria,Louisiana | | River: | Red | | Area: | 174825 km2 | | Lat: | 31.31 | | Lon: | -92.45 | | Source: | RivDIS | | PointID: | 379 | | Area Units: | km2 | | Discharge Units: | m3/sec | | Starting Year: | 1928 | | Ending Year: | 1983 | | Total Years: | 56 | | Total Usable Years: | 54 | |
| |
| Year | Jan | Feb | Mar | Apr | May | Jun | Jul | Aug | Sep | Oct | Nov | Dec | Avg Annual |
|---|
| 1928 | -9999 | -9999 | -9999 | -9999 | -9999 | -9999 | -9999 | -9999 | -9999 | 91 | 205 | 970 | -9999 |
| 1929 | 1516 | 1418 | 1777 | 1069 | 1605 | 1745 | 332 | 121 | 393 | 204 | 363 | 489 | 919.33 |
| 1930 | 1027 | 1543 | 884 | 383 | 2147 | 2516 | 277 | 113 | 101 | 362 | 227 | 1070 | 887.5 |
| 1931 | 664 | 778 | 1091 | 659 | 559 | 159 | 103 | 229 | 87 | 91 | 194 | 1342 | 496.33 |
| 1932 | 3284 | 4219 | 2658 | 1121 | 642 | 478 | 903 | 167 | 152 | 96 | 65 | 276 | 1171.75 |
| 1933 | 1413 | 1059 | 1540 | 1220 | 1480 | 821 | 634 | 1234 | 438 | 212 | 147 | 265 | 871.92 |
| 1934 | 957 | 642 | 1582 | 1687 | 758 | 223 | 86 | 41 | 140 | 111 | 163 | 470 | 571.67 |
| 1935 | 869 | 1192 | 1362 | 866 | 3313 | 3539 | 1721 | 286 | 254 | 141 | 393 | 942 | 1239.83 |
| 1936 | 319 | 267 | 281 | 151 | 563 | 368 | 157 | 60 | 97 | 662 | 416 | 365 | 308.83 |
| 1937 | 1976 | 1639 | 1189 | 1243 | 693 | 532 | 184 | 155 | 362 | 286 | 529 | 747 | 794.58 |
| 1938 | 2064 | 3001 | 2463 | 3143 | 1192 | 945 | 279 | 182 | 88 | 62 | 102 | 94 | 1134.58 |
| 1939 | 603 | 1370 | 1531 | 1877 | 659 | 308 | 233 | 88 | 65 | 46 | 51 | 149 | 581.67 |
| 1940 | 189 | 489 | 275 | 1001 | 1176 | 1435 | 1584 | 594 | 205 | 74 | 534 | 1924 | 790 |
| 1941 | 1701 | 1236 | 1547 | 1405 | 2925 | 2565 | 1097 | 337 | 284 | 991 | 1705 | 814 | 1383.92 |
| 1942 | 726 | 604 | 1082 | 2569 | 378 | 1470 | 562 | 249 | 503 | 279 | 503 | 249 | 764.5 |
| 1943 | 788 | 354 | 550 | 1195 | 1224 | 1048 | 220 | 83 | 62 | 63 | 91 | 139 | 484.75 |
| 1944 | 528 | 1161 | 2162 | 1790 | 3063 | 1328 | 151 | 75 | 113 | 64 | 144 | 603 | 931.83 |
| 1945 | 1866 | 1306 | 4185 | 5615 | 2714 | 1929 | 1694 | 630 | 242 | 1675 | 613 | 470 | 1911.58 |
| 1946 | 2350 | 3140 | 2134 | 1606 | 2288 | 2349 | 483 | 198 | 263 | 149 | 1996 | 2198 | 1596.17 |
| 1947 | 1795 | 874 | 1307 | 1834 | 2550 | 1508 | 372 | 145 | 278 | 139 | 361 | 1178 | 1028.42 |
| 1948 | 1382 | 2001 | 2460 | 1098 | 1418 | 686 | 573 | 155 | 108 | 87 | 196 | 194 | 863.17 |
| 1949 | 1040 | 2747 | 1664 | 1360 | 1092 | 1136 | 382 | 231 | 138 | 508 | 586 | 485 | 947.42 |
| 1950 | 2596 | 3573 | 1749 | 623 | 3029 | 1467 | 723 | 1499 | 1722 | 1090 | 300 | 250 | 1551.75 |
| 1951 | 713 | 1493 | 1303 | 792 | 784 | 1924 | 1412 | 216 | 177 | 134 | 354 | 454 | 813 |
| 1952 | 599 | 887 | 1054 | 1966 | 1543 | 481 | 152 | 139 | 108 | 85 | 99 | 594 | 642.25 |
| 1953 | 496 | 900 | 1527 | 1253 | 4309 | 1300 | 434 | 521 | 164 | 119 | 107 | 287 | 951.42 |
| 1954 | 547 | 701 | 320 | 457 | 1684 | 861 | 206 | 129 | 93 | 477 | 448 | 213 | 511.33 |
| 1955 | 395 | 710 | 945 | 1295 | 683 | 659 | 391 | 468 | 175 | 696 | 176 | 201 | 566.17 |
| 1956 | 176 | 1341 | 585 | 449 | 632 | 182 | 86 | 66 | 52 | 45 | 45 | 93 | 312.67 |
| 1957 | 183 | 853 | 776 | 2297 | 4601 | 4292 | 1622 | 395 | 427 | 848 | 2543 | 1540 | 1698.08 |
| 1958 | 1613 | 1082 | 1339 | 1185 | 3887 | 1022 | 936 | 533 | 618 | 368 | 380 | 289 | 1104.33 |
| 1959 | 287 | 761 | 973 | 970 | 572 | 582 | 417 | 566 | 212 | 768 | 353 | 978 | 619.92 |
| 1960 | 1691 | 1424 | 1335 | 448 | 773 | 502 | 345 | 304 | 174 | 327 | 465 | 1501 | 774.08 |
| 1961 | 1614 | 1208 | 1546 | 2151 | 809 | 485 | 794 | 462 | 499 | 458 | 611 | 2235 | 1072.67 |
| 1962 | 1488 | 1588 | 1413 | 1163 | 1045 | 834 | 382 | 191 | 328 | 487 | 412 | 786 | 843.08 |
| 1963 | 485 | 279 | 592 | 339 | 583 | 167 | 222 | 156 | 109 | 61 | 55 | 98 | 262.17 |
| 1964 | 126 | 152 | 692 | 888 | 1156 | 217 | 120 | 99 | 223 | 403 | 340 | 437 | 404.42 |
| 1965 | 443 | 1281 | 1072 | 746 | 554 | 619 | 246 | 153 | 150 | 204 | 127 | 184 | 481.58 |
| 1966 | 261 | 1029 | 390 | 475 | 2976 | 693 | 576 | 327 | 253 | 273 | 168 | 177 | 633.17 |
| 1967 | 314 | 252 | 248 | 921 | 1527 | 1353 | 496 | 155 | 447 | 171 | 402 | 620 | 575.5 |
| 1968 | -9999 | -9999 | -9999 | -9999 | -9999 | -9999 | -9999 | -9999 | -9999 | -9999 | -9999 | -9999 | -9999 |
| 1969 | 820 | 2460 | 2400 | 1870 | 2510 | 910 | 251 | 138 | 158 | 256 | 276 | 308 | 1029.75 |
| 1970 | 860 | 782 | 1940 | 990 | 1470 | 442 | 179 | 264 | 221 | 506 | 582 | 270 | 708.83 |
| 1971 | 472 | 396 | 640 | 280 | 513 | 204 | 147 | 272 | 232 | 367 | 409 | 2060 | 499.33 |
| 1972 | 1680 | 907 | 481 | 308 | 330 | 170 | 171 | 134 | 75.5 | 123 | 1400 | 1000 | 564.96 |
| 1973 | 1070 | 1530 | 2520 | 2740 | 2960 | 1920 | 579 | 253 | 607 | 1180 | 1570 | 2840 | 1647.42 |
| 1974 | 2340 | 1560 | 969 | 952 | 1370 | 1860 | 485 | 256 | 1440 | 1260 | 2780 | 2400 | 1472.67 |
| 1975 | 1530 | 2600 | 2210 | 1870 | 2420 | 2360 | 756 | 561 | 306 | 246 | 193 | 244 | 1274.67 |
| 1976 | 344 | 329 | 991 | 599 | 861 | 735 | 699 | 266 | 180 | 210 | 228 | 464 | 492.17 |
| 1977 | 573 | 990 | 1350 | 2170 | 691 | 600 | 191 | 202 | 186 | 133 | 209 | 248 | 628.58 |
| 1978 | 365 | 587 | 685 | 603 | 678 | 530 | 198 | 118 | 141 | 90 | 268 | 407 | 389.17 |
| 1979 | 1440 | 1510 | 1720 | 2400 | 1650 | 1740 | 314 | 415 | 253 | 302 | 307 | 432 | 1040.25 |
| 1980 | 908 | 1347 | 676 | 1387 | 1056 | 800 | 247 | 149 | 192 | 350 | 263 | 352 | 643.92 |
| 1981 | 151 | 282 | 466 | 215 | 583 | 1838 | 727 | 179 | 192 | 766 | 1860 | 543 | 650.17 |
| 1982 | 313 | 1222 | 738 | 636 | 1105 | 2427 | 1714 | 404 | 130 | 114 | 249 | 2646 | 974.83 |
| 1983 | 2076 | 1954 | 1668 | 877 | 1568 | 1175 | 916 | 232 | 150 | -9999 | -9999 | -9999 | -9999 |
| |
|
|
|
|
|
|
|
|
|
|
|
|
|
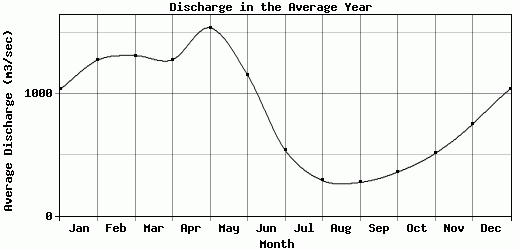
| Avg | 1037.52 | 1277.96 | 1315.5 | 1281.61 | 1543.54 | 1156.28 | 540.02 | 288.8 | 273.47 | 357.59 | 510.43 | 751.56 | 858.76 |
| |
|
|
|
|
|
|
|
|
|
|
|
|
|
| Std Dev | 732.8 |
855.43 |
750.33 |
911.26 |
1057.08 |
872.1 |
454.78 |
260.48 |
290.83 |
353.01 |
610.53 |
709.66 |
383.15 |
| |
|
|
|
|
|
|
|
|
|
|
|
|
|
| | Jan | Feb | Mar | Apr | May | Jun | Jul | Aug | Sep | Oct | Nov | Dec | Avg Annual |
Click here for this table in tab-delimited format.
Tab-delimited format will open in most table browsing software, i.e. Excel, etc.
View this station on the map.
Return to start.