Results
| Country: | U.S.A.
| | Station: | BURKBURNETT, TX | | River: | RED RIVER | | Area: | 53273.14 | | Lat: | 34.11 | | Lon: | -98.53 | | Source: | USGS | | PointID: | 7308500 | | Area Units: | km2 | | Discharge Units: | m3/sec | | Starting Year: | 1966 | | Ending Year: | 1993 | | Total Years: | 28 | | Total Usable Years: | 27 | |
| |
| Year | Jan | Feb | Mar | Apr | May | Jun | Jul | Aug | Sep | Oct | Nov | Dec | Avg Annual |
|---|
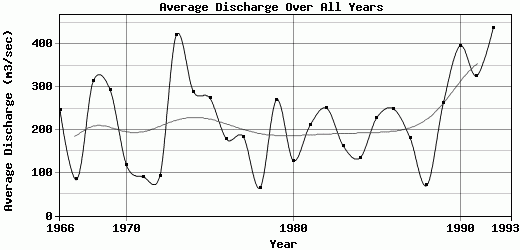
| 1966 | 102.32 | 238.72 | 71.52 | 298.68 | 1528.84 | 344.81 | 169.45 | 64.64 | 60.02 | 47.47 | 19.27 | 23.67 | 247.45 |
| 1967 | 25.92 | 29.48 | 27.09 | 93.36 | 67 | 140.3 | 58.83 | 15.5 | 70.75 | 79.52 | 248.9 | 155.71 | 84.36 |
| 1968 | 320.9 | 261.92 | 409.35 | 839.03 | 774.96 | 623.03 | 189.82 | 57.8 | 36.78 | 36.59 | 49.12 | 167.57 | 313.91 |
| 1969 | 83 | 249.52 | 616.4 | 799.58 | 1035.85 | 416.67 | 60.22 | 38.38 | 35.6 | 33.85 | 62.68 | 101.04 | 294.4 |
| 1970 | 135.21 | 120.4 | 604.07 | 224.78 | 89.47 | 75.29 | 55.88 | 31.14 | 28.23 | 20.05 | 12.72 | 8.98 | 117.19 |
| 1971 | 9.09 | 13.36 | 28.73 | 35.73 | 36.65 | 31.43 | 29.52 | 13.71 | 12.89 | 9.61 | 151.87 | 711.78 | 90.36 |
| 1972 | 556.05 | 115.37 | 44.38 | 45.85 | 93.64 | 25.69 | 31.43 | 10.06 | 13.63 | 8.01 | 90.8 | 83.67 | 93.21 |
| 1973 | 240.7 | 254 | 553.58 | 566.6 | 657.96 | 909.67 | 195.15 | 88.54 | 96.32 | 725.69 | 415.7 | 369.75 | 422.81 |
| 1974 | 605.96 | 174.02 | 116.7 | 65.68 | 226.76 | 102.76 | 51.8 | 46.45 | 431.21 | 138.73 | 856.97 | 659.6 | 289.72 |
| 1975 | 339.16 | 827.93 | 280.31 | 442.96 | 536.39 | 513.58 | 128.97 | 93.77 | 27.41 | 27.28 | 35.29 | 30.89 | 273.66 |
| 1976 | 44.7 | 48.5 | 75.69 | 220.35 | 567.91 | 430.21 | 175.93 | 31.27 | 65.35 | 92.63 | 75.13 | 309.11 | 178.07 |
| 1977 | 116.11 | 441.35 | 239.02 | 870.65 | 274.03 | 123.62 | 42.9 | 33.95 | 21.15 | 14.72 | 13.7 | 19.91 | 184.26 |
| 1978 | 104.42 | 163.32 | 135.89 | 49.27 | 51.99 | 72.16 | 60.81 | 45.29 | 33.91 | 14.24 | 26.93 | 16.41 | 64.55 |
| 1979 | 176.93 | 270.49 | 388 | 615.81 | 530.37 | 559.36 | 150.31 | 94.82 | 209.75 | 21.53 | 81.65 | 146.62 | 270.47 |
| 1980 | 228.24 | 280.94 | 142.95 | 206.25 | 468.19 | 60.91 | 53.73 | 24.73 | 26.9 | 17.33 | 15 | 16.39 | 128.46 |
| 1981 | 19.63 | 18.42 | 20.49 | 35.95 | 132.19 | 773.71 | 289.1 | 36.98 | 22.09 | 276.38 | 614.2 | 286.37 | 210.46 |
| 1982 | 219.18 | 191.42 | 193.96 | 253.28 | 522.2 | 653.56 | 372.85 | 193.09 | 69.49 | 18.54 | 87.09 | 231.73 | 250.53 |
| 1983 | 131.55 | 426.45 | 438.42 | 107.99 | 344.54 | 122.23 | 60.24 | 103.21 | 35.82 | 23.51 | 43.44 | 110.25 | 162.3 |
| 1984 | 68.63 | 98.15 | 276.92 | 103.09 | 78.21 | 49.09 | 46.62 | 31.31 | 21.13 | 385.62 | 153.09 | 301.61 | 134.46 |
| 1985 | 310.95 | 243.73 | 392.57 | 193.68 | 341.38 | 151.15 | 46.7 | 35.53 | 38.09 | 74.88 | 382.86 | 521.41 | 227.74 |
| 1986 | 60.22 | 430.51 | 89.75 | 160.02 | 490.76 | 751.82 | 177.25 | 52.9 | 47.56 | 78.89 | 224.15 | 428.28 | 249.34 |
| 1987 | 178.35 | 234.29 | 591 | 161.65 | 90.25 | 487.61 | 152.92 | 34.12 | 26.18 | 13.08 | 50.79 | 163.65 | 181.99 |
| 1988 | 141.48 | 101.73 | 141.79 | 93.62 | 50.58 | 65 | 70.26 | 68.6 | 40.68 | 23.75 | 22.49 | 23.73 | 70.31 |
| 1989 | 38 | 149.84 | 172.02 | 280.45 | 609.89 | 896.04 | 688.47 | 158.52 | 63.48 | 32.34 | 26.14 | 27.39 | 261.88 |
| 1990 | 208.69 | 331.22 | 606.05 | 663.56 | 1638.09 | 753.61 | 167.07 | 132.72 | 40.75 | 42.73 | 98.96 | 71 | 396.2 |
| 1991 | 629.71 | 391 | 178.37 | 439.25 | 316.89 | 149.83 | 59.63 | 107.58 | 118.37 | 62.34 | 597.68 | 857.27 | 325.66 |
| 1992 | 1289.89 | 1094.7 | 1146.56 | 339.11 | 218.37 | 397.03 | 140.78 | 51.13 | 42.12 | 20.48 | 89.18 | 428.61 | 438.16 |
| 1993 | -9999 | -9999 | -9999 | -9999 | -9999 | -9999 | -9999 | -9999 | -9999 | -9999 | -9999 | -9999 | -9999 |
| |
|
|
|
|
|
|
|
|
|
|
|
|
|
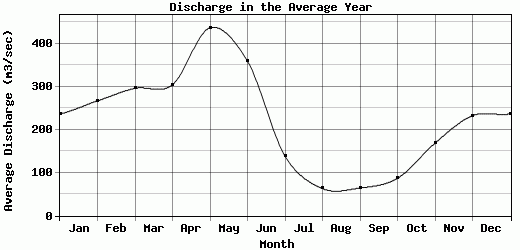
| Avg | 236.48 | 266.7 | 295.61 | 303.93 | 436.05 | 358.52 | 138.02 | 62.81 | 64.28 | 86.66 | 168.36 | 232.31 | 220.81 |
| |
|
|
|
|
|
|
|
|
|
|
|
|
|
| Std Dev | 266.42 |
233.68 |
257.79 |
255.75 |
410.92 |
290.92 |
135.73 |
44.6 |
82.09 |
150.43 |
214.51 |
232.24 |
103.98 |
| |
|
|
|
|
|
|
|
|
|
|
|
|
|
| | Jan | Feb | Mar | Apr | May | Jun | Jul | Aug | Sep | Oct | Nov | Dec | Avg Annual |
Click here for this table in tab-delimited format.
Tab-delimited format will open in most table browsing software, i.e. Excel, etc.
View this station on the map.
Return to start.