Results
| Country: | U.S.A.
| | Station: | Colbert, OK | | River: | Red River | | Area: | 103016.32 | | Lat: | 33.82 | | Lon: | -96.52 | | Source: | USGS | | PointID: | 7332000 | | Area Units: | km2 | | Discharge Units: | m3/sec | | Starting Year: | 1945 | | Ending Year: | 1970 | | Total Years: | 26 | | Total Usable Years: | 25 | |
| |
| Year | Jan | Feb | Mar | Apr | May | Jun | Jul | Aug | Sep | Oct | Nov | Dec | Avg Annual |
|---|
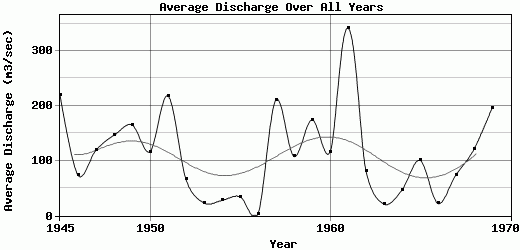
| 1945 | 31.67 | 48.6 | 463.08 | 814.39 | 166.65 | 94.76 | 237.73 | 8.35 | 177.92 | 568.24 | 15.38 | 10.79 | 219.8 |
| 1946 | 254.28 | 156.12 | 144.2 | 92.32 | 87.36 | 23.8 | 4.9 | 1.05 | 7.92 | 6.04 | 81.86 | 25.03 | 73.74 |
| 1947 | 9.23 | 3.74 | 70.71 | 708.09 | 395.74 | 186.08 | 35.48 | 3.43 | 6.4 | 1.61 | 1.86 | 6.18 | 119.05 |
| 1948 | 3.93 | 4.98 | 120.35 | 78.79 | 68.63 | 414.28 | 816.52 | 198.01 | 7.12 | 2.09 | 32.58 | 6.17 | 146.12 |
| 1949 | 273.93 | 422.43 | 166.57 | 163.19 | 385.65 | 235.64 | 197.49 | 27.67 | 46.78 | 43.61 | 9.92 | 8.95 | 165.15 |
| 1950 | 27.93 | 28.67 | 23.8 | 25.4 | 247.48 | 222.48 | 362.89 | 333.69 | 91.25 | 25.84 | 5.19 | 4.78 | 116.62 |
| 1951 | 5.91 | 86.45 | 53.34 | 67.07 | 262.78 | 325.5 | 999.57 | 94.12 | 264.02 | 94.07 | 298.38 | 63.43 | 217.89 |
| 1952 | 70.11 | 76.18 | 320.9 | 219.99 | 61.79 | 26.35 | 4.15 | 2.59 | 1.52 | 1.21 | 2.36 | 2.97 | 65.84 |
| 1953 | 2.8 | 2.76 | 31.57 | 84.22 | 107.14 | 13.8 | 10.65 | 1.53 | 10.93 | 4.01 | 6.07 | 4.18 | 23.31 |
| 1954 | 1.48 | 1.57 | 2.49 | 12.75 | 226.76 | 30.86 | 0.96 | 1.84 | 0.48 | 47.51 | 4.51 | 1.85 | 27.75 |
| 1955 | 16.11 | 15.06 | 40.02 | 11.36 | 182.35 | 79.21 | 6.22 | 1.53 | 1.68 | 58.71 | 1.03 | 0.96 | 34.52 |
| 1956 | 0.77 | 1.69 | 1.1 | 3.98 | 10.05 | 16.27 | 4.78 | 0.6 | 0.31 | 0.66 | 1.05 | 1.57 | 3.57 |
| 1957 | 1.48 | 4.6 | 6.99 | 276.49 | 812.18 | 1172.32 | 184.93 | 8.53 | 12.33 | 9.59 | 25.88 | 10.95 | 210.52 |
| 1958 | 19.52 | 29.4 | 492.54 | 280.76 | 121.06 | 31.95 | 230.16 | 23.85 | 38.69 | 5.36 | 16.45 | 7.54 | 108.11 |
| 1959 | 8.83 | 24.8 | 41.89 | 76.67 | 197.78 | 36.49 | 514.57 | 91.73 | 44.36 | 906.73 | 55.8 | 93.08 | 174.39 |
| 1960 | 92.25 | 136.39 | 253.41 | 209.21 | 323.66 | 129.57 | 33.24 | 40.87 | 8.96 | 19.78 | 62.49 | 78.83 | 115.72 |
| 1961 | 16.19 | 53.64 | 135.92 | 272.49 | 1180.1 | 240.53 | 249.87 | 184.51 | 681.15 | 274.16 | 565.91 | 247.09 | 341.8 |
| 1962 | 95.57 | 127.4 | 138.2 | 85.57 | 20.62 | 98.92 | 21.32 | 4.6 | 219.66 | 113.23 | 21.71 | 32.05 | 81.57 |
| 1963 | 80.79 | 18.59 | 104.41 | 22.74 | 9.37 | 2.63 | 9.14 | 2.03 | 1.31 | 0.95 | 1.27 | 1.25 | 21.21 |
| 1964 | 1.29 | 1.99 | 3.39 | 106.55 | 17.12 | 97.03 | 4.82 | 37.86 | 19.78 | 2.31 | 190.8 | 74.49 | 46.45 |
| 1965 | 59.79 | 29.27 | 66.34 | 468.8 | 83.4 | 296.71 | 25.16 | 2.39 | 161.33 | 10.45 | 1.85 | 3.56 | 100.75 |
| 1966 | 8.04 | 25.48 | 34.72 | 21.45 | 49.62 | 71.53 | 2.22 | 14.67 | 25.33 | 1.83 | 1.38 | 9.38 | 22.14 |
| 1967 | 6.33 | 2.44 | 2.1 | 45.7 | 55.97 | 164.1 | 242.17 | 41.25 | 92.42 | 88.22 | 119.25 | 32.54 | 74.37 |
| 1968 | 59.56 | 77.33 | 225.03 | 258.18 | 109.95 | 140.08 | 47.74 | 105.16 | 12.68 | 50.16 | 199.78 | 163.26 | 120.74 |
| 1969 | 127.44 | 148.29 | 218.09 | 351.86 | 208.39 | 619.86 | 254.67 | 17.51 | 41.88 | 265.69 | 48.6 | 44.27 | 195.55 |
| 1970 | -9999 | -9999 | -9999 | -9999 | -9999 | -9999 | -9999 | -9999 | -9999 | -9999 | -9999 | -9999 | -9999 |
| |
|
|
|
|
|
|
|
|
|
|
|
|
|
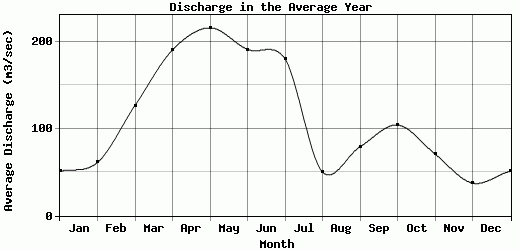
| Avg | 51.01 | 61.11 | 126.45 | 190.32 | 215.66 | 190.83 | 180.05 | 49.97 | 79.05 | 104.08 | 70.85 | 37.41 | 113.07 |
| |
|
|
|
|
|
|
|
|
|
|
|
|
|
| Std Dev | 72.14 |
88.37 |
134.56 |
207.13 |
260.21 |
246.51 |
255.07 |
79.34 |
142.74 |
206 |
125.43 |
57.43 |
79.94 |
| |
|
|
|
|
|
|
|
|
|
|
|
|
|
| | Jan | Feb | Mar | Apr | May | Jun | Jul | Aug | Sep | Oct | Nov | Dec | Avg Annual |
Click here for this table in tab-delimited format.
Tab-delimited format will open in most table browsing software, i.e. Excel, etc.
View this station on the map.
Return to start.