Results
| Country: | U.S.A.
| | Station: | Denison Dam nr Denison, TX | | River: | Red River | | Area: | 102868.70 | | Lat: | 33.82 | | Lon: | -96.56 | | Source: | USGS | | PointID: | 7331600 | | Area Units: | km2 | | Discharge Units: | m3/sec | | Starting Year: | 1979 | | Ending Year: | 1993 | | Total Years: | 15 | | Total Usable Years: | 12 | |
| |
| Year | Jan | Feb | Mar | Apr | May | Jun | Jul | Aug | Sep | Oct | Nov | Dec | Avg Annual |
|---|
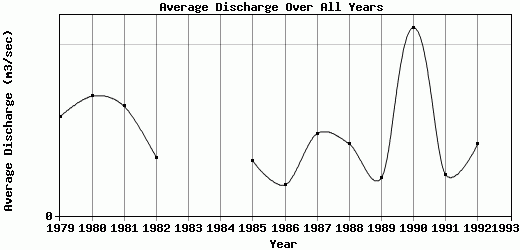
| 1979 | 0.32 | 1.04 | 0.64 | 0.46 | 0.12 | 0.02 | 0.06 | 0.38 | 0.08 | 0.16 | 0.16 | 0.05 | 0.29 |
| 1980 | 0.19 | 1.66 | 0.93 | 0.16 | 0.14 | 0.09 | 0.32 | 0.06 | 0.18 | 0.19 | 0.15 | 0.12 | 0.35 |
| 1981 | 0.17 | 0.13 | 0.39 | 0.2 | 0.1 | 0.08 | 0.04 | 1.57 | 0.62 | 0.27 | 0.14 | 0.12 | 0.32 |
| 1982 | 0.09 | 0.19 | 0.51 | 0.14 | 0.16 | 0.04 | 0.03 | 0.08 | 0.19 | 0.17 | 0.24 | 0.18 | 0.17 |
| 1983 | -9999 | -9999 | -9999 | -9999 | -9999 | -9999 | -9999 | -9999 | -9999 | -9999 | -9999 | -9999 | -9999 |
| 1984 | -9999 | -9999 | -9999 | -9999 | -9999 | -9999 | -9999 | -9999 | -9999 | -9999 | -9999 | -9999 | -9999 |
| 1985 | 0.16 | 0.09 | 0.14 | 0.19 | 0.29 | 0.19 | 0.26 | 0.07 | 0.1 | 0.13 | 0.14 | 0.14 | 0.16 |
| 1986 | 0.11 | 0.11 | 0.14 | 0.07 | 0.05 | 0.07 | 0.09 | 0.03 | 0.13 | 0.11 | 0.07 | 0.1 | 0.09 |
| 1987 | 0.21 | 0.62 | 0.37 | 0.12 | 0.13 | 0.12 | 0.1 | 0.14 | 0.11 | 0.11 | 0.68 | 0.15 | 0.24 |
| 1988 | 0.38 | 0.37 | 0.17 | 0.43 | 0.13 | 0.11 | 0.11 | 0.2 | 0.18 | 0.1 | 0.12 | 0.26 | 0.21 |
| 1989 | 0.1 | 0.1 | 0.16 | 0.19 | 0.16 | 0.03 | 0.07 | 0.07 | 0.08 | 0.13 | 0.11 | 0.11 | 0.11 |
| 1990 | 0.06 | 0.02 | 0.04 | 0.04 | 0.08 | 0.32 | 0.42 | 4.02 | 1.01 | 0.23 | 0.25 | 0.05 | 0.55 |
| 1991 | 0.05 | 0.11 | 0.33 | 0.46 | 0.07 | 0.04 | 0.04 | 0.04 | 0.27 | 0.01 | 0.04 | 0.01 | 0.12 |
| 1992 | 0.01 | 0.09 | 1.32 | 0.53 | 0.08 | 0.08 | 0.04 | 0.05 | 0.22 | 0.09 | 0.02 | 0.02 | 0.21 |
| 1993 | -9999 | -9999 | -9999 | -9999 | -9999 | -9999 | -9999 | -9999 | -9999 | -9999 | -9999 | -9999 | -9999 |
| |
|
|
|
|
|
|
|
|
|
|
|
|
|
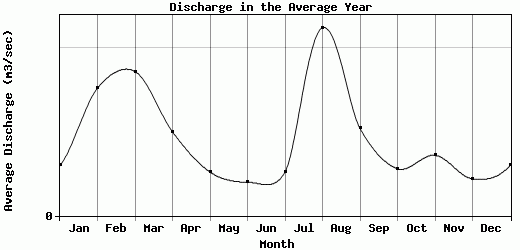
| Avg | 0.15 | 0.38 | 0.43 | 0.25 | 0.13 | 0.1 | 0.13 | 0.56 | 0.26 | 0.14 | 0.18 | 0.11 | 0.24 |
| |
|
|
|
|
|
|
|
|
|
|
|
|
|
| Std Dev | 0.11 |
0.48 |
0.36 |
0.16 |
0.06 |
0.08 |
0.12 |
1.12 |
0.26 |
0.07 |
0.17 |
0.07 |
0.12 |
| |
|
|
|
|
|
|
|
|
|
|
|
|
|
| | Jan | Feb | Mar | Apr | May | Jun | Jul | Aug | Sep | Oct | Nov | Dec | Avg Annual |
Click here for this table in tab-delimited format.
Tab-delimited format will open in most table browsing software, i.e. Excel, etc.
View this station on the map.
Return to start.