Results
| Country: | U.S.A.
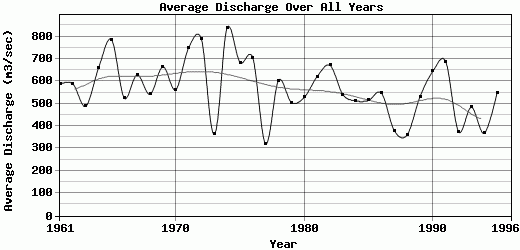
| | Station: | DRAYTON, ND | | River: | RED RIVER OF THE NORTH AT | | Area: | 23361220.78 | | Lat: | 48.57 | | Lon: | -97.14 | | Source: | USGS | | PointID: | 5092000 | | Area Units: | km2 | | Discharge Units: | m3/sec | | Starting Year: | 1961 | | Ending Year: | 1996 | | Total Years: | 36 | | Total Usable Years: | 35 | |
| |
| Year | Jan | Feb | Mar | Apr | May | Jun | Jul | Aug | Sep | Oct | Nov | Dec | Avg Annual |
|---|
| 1961 | 253.32 | 356.89 | 546.15 | 777.11 | 1595.16 | 1826.54 | 430.87 | 173.55 | 207.44 | 293.85 | 238.5 | 348.24 | 587.3 |
| 1962 | 444.77 | 626.01 | 380.66 | 807.65 | 1571.68 | 1285.59 | 558.37 | 226.51 | 163.4 | 245.92 | 297.63 | 452.89 | 588.42 |
| 1963 | 451.03 | 565.13 | 514.89 | 660.54 | 838.55 | 1110.4 | 631.01 | 215.24 | 147.08 | 236.25 | 201.24 | 280.88 | 487.69 |
| 1964 | 343.94 | 430.91 | 507.92 | 440.8 | 1076.41 | 2529.75 | 928.25 | 274.58 | 282.93 | 275.31 | 350.83 | 457.02 | 658.22 |
| 1965 | 467.23 | 664.74 | 854.63 | 1036.97 | 1750.26 | 1954.63 | 829.6 | 358.58 | 382.15 | 367.73 | 341.94 | 429.07 | 786.46 |
| 1966 | 421.91 | 482.7 | 472.48 | 677.06 | 848.96 | 1199.41 | 563.44 | 198 | 298.36 | 418.32 | 402.5 | 329.98 | 526.09 |
| 1967 | 364.41 | 477.14 | 522.4 | 536.32 | 1158.07 | 2183.43 | 708.45 | 231.77 | 233.92 | 320.54 | 352.32 | 456.27 | 628.75 |
| 1968 | 457.37 | 381.73 | 496.83 | 548.5 | 775.52 | 1296.45 | 558.93 | 256.97 | 408.29 | 431.88 | 451.37 | 434.46 | 541.53 |
| 1969 | 479.3 | 530.24 | 564.42 | 1249.25 | 1647.78 | 1066.89 | 690.33 | 346.35 | 371.04 | 390.84 | 296.67 | 341.53 | 664.55 |
| 1970 | 288.43 | 268.34 | 393 | 491.39 | 1176.8 | 1773.49 | 613.13 | 312.52 | 355.82 | 398.08 | 279.49 | 398.25 | 562.4 |
| 1971 | 454.61 | 660.6 | 517.54 | 794.02 | 2004.3 | 1988.14 | 815.99 | 320.69 | 293.3 | 340.06 | 357.17 | 430.33 | 748.06 |
| 1972 | 430.75 | 442.04 | 917.74 | 955.43 | 1729.35 | 2490.29 | 817.55 | 323.56 | 258.96 | 344.11 | 369.34 | 376.64 | 787.98 |
| 1973 | 405.71 | 405.42 | 470.7 | 389.76 | 409.4 | 613.72 | 378.56 | 213.22 | 137.01 | 250.56 | 332.7 | 351.84 | 363.22 |
| 1974 | 629.53 | 560.68 | 629.09 | 1121.26 | 1606.4 | 2621.87 | 1152.68 | 391.32 | 272.1 | 307.35 | 391.92 | 378.47 | 838.56 |
| 1975 | 413.13 | 335.64 | 371.01 | 391.27 | 925.87 | 2318.03 | 1137.62 | 425.66 | 350.47 | 457.63 | 454.38 | 625.66 | 683.86 |
| 1976 | 487.18 | 538.8 | 536.89 | 833.56 | 2004.2 | 1436.9 | 862.76 | 417.45 | 302.67 | 302.03 | 360.92 | 368.19 | 704.3 |
| 1977 | 424.41 | 286.74 | 357.97 | 137.99 | 459.11 | 379.54 | 235.87 | 246.27 | 229.36 | 336.43 | 377.57 | 385.9 | 321.43 |
| 1978 | 397.3 | 420.93 | 419.13 | 732.47 | 1077.6 | 1417.55 | 879.93 | 320.63 | 341.64 | 369.41 | 435.6 | 432.19 | 603.7 |
| 1979 | 390.19 | 306.98 | 288.72 | 452.34 | 1362.78 | 1152.6 | 495.32 | 296.58 | 258.38 | 304.48 | 388.43 | 364.17 | 505.08 |
| 1980 | 302.37 | 275.21 | 264.54 | 365.89 | 1282.49 | 1446.62 | 581.3 | 264.31 | 304.04 | 375.53 | 369.42 | 503.21 | 527.91 |
| 1981 | 476.91 | 503.88 | 429.5 | 512.92 | 1364.88 | 1807.29 | 741.45 | 258.41 | 250.13 | 401.87 | 373.27 | 322.86 | 620.28 |
| 1982 | 385.58 | 485.4 | 453.44 | 603.15 | 1484.91 | 1993.61 | 1153.23 | 334.73 | 251.58 | 287.69 | 304.95 | 314.11 | 671.03 |
| 1983 | 451.1 | 451.85 | 419.04 | 506.12 | 921.49 | 1057.83 | 825.82 | 327.72 | 371.62 | 399.13 | 418.34 | 340.74 | 540.9 |
| 1984 | 466.73 | 411.77 | 381.79 | 474.63 | 755.88 | 1303.34 | 598.05 | 289.15 | 347.37 | 382.78 | 356.7 | 381 | 512.43 |
| 1985 | 375.91 | 354.93 | 400.87 | 543.93 | 951.63 | 1020.07 | 378.28 | 364.52 | 464.59 | 444.69 | 463.68 | 409.99 | 514.42 |
| 1986 | 416.19 | 506.42 | 705.73 | 761.35 | 895.46 | 1214.42 | 389.15 | 206.75 | 346.86 | 369.56 | 391.41 | 365.88 | 547.43 |
| 1987 | 359.91 | 312.69 | 268.89 | 499.2 | 805.57 | 438.17 | 272.64 | 261.37 | 360.34 | 347.08 | 318.19 | 314.6 | 379.89 |
| 1988 | 215.92 | 312.61 | 439.92 | 593.69 | 641.33 | 593.81 | 273.84 | 151.51 | 167.3 | 268.37 | 343.19 | 321.64 | 360.26 |
| 1989 | 231.23 | 297.38 | 347.81 | 684.12 | 1082.62 | 1040.08 | 516.19 | 409.35 | 443.29 | 345.49 | 448.16 | 513.91 | 529.97 |
| 1990 | 506.28 | 419.85 | 387.93 | 946.73 | 1040.33 | 1662.59 | 755.33 | 326.22 | 320.88 | 424.23 | 494.51 | 445.24 | 644.18 |
| 1991 | 506.31 | 600.22 | 512.74 | 709.81 | 1385.98 | 1669.57 | 944.78 | 318.33 | 359.47 | 403.61 | 428.19 | 411.97 | 687.58 |
| 1992 | 366.52 | 280.14 | 317.85 | 471.11 | 567.36 | 526.08 | 350.94 | 265.7 | 324.85 | 402.79 | 343.76 | 289.86 | 375.58 |
| 1993 | 428.61 | 252.9 | 330.78 | 430.52 | 950.22 | 817.61 | 693.31 | 336.14 | 354.33 | 334.28 | 405.75 | 467.71 | 483.51 |
| 1994 | 457.56 | 353.48 | 343.73 | 462.97 | 734.14 | 614.1 | 250.5 | 165.66 | 143.53 | 249.42 | 377.27 | 261.19 | 367.8 |
| 1995 | 286.55 | 489.98 | 445.34 | 378.58 | 622.38 | 1339.96 | 681.62 | 296.56 | 257.33 | 339.37 | 563.13 | 891.44 | 549.35 |
| 1996 | -9999 | -9999 | -9999 | -9999 | -9999 | -9999 | -9999 | -9999 | -9999 | -9999 | -9999 | -9999 | -9999 |
| |
|
|
|
|
|
|
|
|
|
|
|
|
|
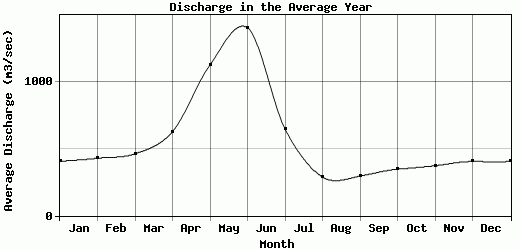
| Avg | 406.81 | 430.01 | 463.2 | 627.95 | 1128.71 | 1405.44 | 648.43 | 289.31 | 296.05 | 347.62 | 373.73 | 405.64 | 568.57 |
| |
|
|
|
|
|
|
|
|
|
|
|
|
|
| Std Dev | 84.4 |
115.93 |
142.53 |
234.38 |
420.89 |
603.94 |
250.45 |
70.23 |
82.56 |
59.9 |
69.87 |
110.74 |
128.66 |
| |
|
|
|
|
|
|
|
|
|
|
|
|
|
| | Jan | Feb | Mar | Apr | May | Jun | Jul | Aug | Sep | Oct | Nov | Dec | Avg Annual |
Click here for this table in tab-delimited format.
Tab-delimited format will open in most table browsing software, i.e. Excel, etc.
View this station on the map.
Return to start.