Results
| Country: | U.S.A.
| | Station: | ESTELLINE,TEX(DISC) | | River: | PDTF RED RIVER | | Area: | 18887.75 | | Lat: | 34.5 | | Lon: | -100.44 | | Source: | USGS | | PointID: | 7299500 | | Area Units: | km2 | | Discharge Units: | m3/sec | | Starting Year: | 1981 | | Ending Year: | 1994 | | Total Years: | 14 | | Total Usable Years: | 13 | |
| |
| Year | Jan | Feb | Mar | Apr | May | Jun | Jul | Aug | Sep | Oct | Nov | Dec | Avg Annual |
|---|
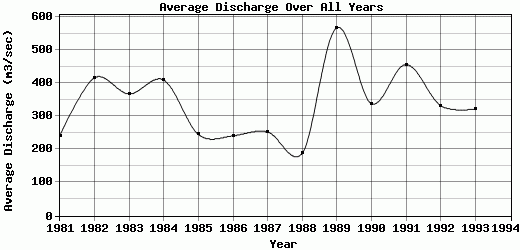
| 1981 | 70.58 | 126.46 | 104.37 | 136.78 | 227.3 | 660.12 | 298.09 | 285.97 | 271.7 | 255.94 | 210.14 | 256.45 | 241.99 |
| 1982 | 598.88 | 661.71 | 514.46 | 358.2 | 195.58 | 333.92 | 357.75 | 447.35 | 458.18 | 296.41 | 301.79 | 479.89 | 417.01 |
| 1983 | 495.82 | 470.93 | 244.51 | 205.86 | 731.96 | 701.12 | 356.38 | 391.76 | 241.37 | 127.05 | 145.95 | 304.03 | 368.06 |
| 1984 | 220.38 | 330.13 | 491.41 | 650.44 | 1064.35 | 559.66 | 256.45 | 286.54 | 143.57 | 131.17 | 337.97 | 450.68 | 410.23 |
| 1985 | 527.39 | 427.12 | 262.37 | 178.26 | 111.16 | 154.21 | 186.37 | 225.14 | 177.88 | 99.57 | 184.81 | 413.88 | 245.68 |
| 1986 | 246.38 | 248 | 173.78 | 160.76 | 180.74 | 162.05 | 172.44 | 189.76 | 138.45 | 141.85 | 419.83 | 663.53 | 241.46 |
| 1987 | 505.73 | 299.77 | 336.04 | 384.89 | 157.56 | 174.82 | 357.39 | 226.12 | 128.71 | 154.59 | 122.45 | 189.53 | 253.13 |
| 1988 | 250.29 | 181.01 | 222.36 | 211.46 | 121.48 | 159.57 | 184.67 | 168.35 | 124.85 | 89.36 | 170.33 | 377.69 | 188.45 |
| 1989 | 628.09 | 759.61 | 1022.15 | 457.9 | 353.22 | 620.91 | 545.24 | 353.33 | 359.11 | 534.86 | 588.43 | 593.93 | 568.06 |
| 1990 | 471.25 | 790.55 | 415.95 | 226.25 | 327.54 | 231.45 | 231.4 | 251.73 | 162.58 | 176.85 | 184.17 | 597.7 | 338.95 |
| 1991 | 930.44 | 815.71 | 1050.2 | 685.6 | 276.1 | 304.28 | 263.16 | 233.41 | 191.91 | 142.02 | 140.24 | 453.53 | 457.22 |
| 1992 | 482.12 | 305.24 | 435.98 | 328.2 | 153.95 | 352.64 | 343.81 | 331.8 | 371.08 | 275.18 | 273.19 | 339.32 | 332.71 |
| 1993 | 576.94 | 309.38 | 502.52 | 600.23 | 225.58 | 199.79 | 239.4 | 243.4 | 184.34 | 148.96 | 165.25 | 479.34 | 322.93 |
| 1994 | -9999 | -9999 | -9999 | -9999 | -9999 | -9999 | -9999 | -9999 | -9999 | -9999 | -9999 | -9999 | -9999 |
| |
|
|
|
|
|
|
|
|
|
|
|
|
|
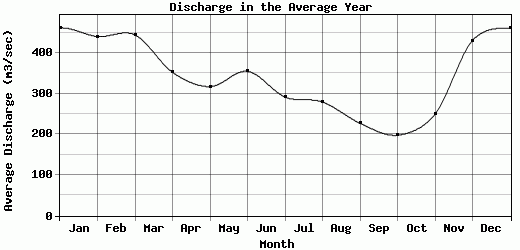
| Avg | 461.87 | 440.43 | 444.32 | 352.68 | 317.42 | 354.96 | 291.73 | 279.59 | 227.21 | 197.99 | 249.58 | 430.73 | 337.38 |
| |
|
|
|
|
|
|
|
|
|
|
|
|
|
| Std Dev | 212.98 |
229.66 |
282.18 |
184.99 |
265.47 |
199.24 |
98.1 |
78.18 |
103.17 |
115.85 |
129.25 |
133.15 |
102.43 |
| |
|
|
|
|
|
|
|
|
|
|
|
|
|
| | Jan | Feb | Mar | Apr | May | Jun | Jul | Aug | Sep | Oct | Nov | Dec | Avg Annual |
Click here for this table in tab-delimited format.
Tab-delimited format will open in most table browsing software, i.e. Excel, etc.
View this station on the map.
Return to start.