Results
| Country: | Germany
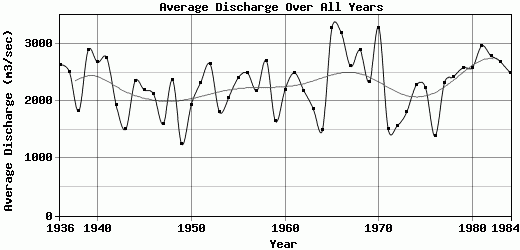
| | Station: | Rees | | River: | Rhine | | Area: | 159680 km2 | | Lat: | 51.76 | | Lon: | 6.4 | | Source: | RivDIS | | PointID: | 745 | | Area Units: | km2 | | Discharge Units: | m3/sec | | Starting Year: | 1936 | | Ending Year: | 1984 | | Total Years: | 49 | | Total Usable Years: | 49 | |
| |
| Year | Jan | Feb | Mar | Apr | May | Jun | Jul | Aug | Sep | Oct | Nov | Dec | Avg Annual |
|---|
| 1936 | 4180 | 3140 | 1900 | 2750 | 2350 | 2330 | 2700 | 2930 | 1930 | 2240 | 2620 | 2540 | 2634.17 |
| 1937 | 2540 | 4490 | 4400 | 3900 | 3030 | 2620 | 2140 | 1610 | 1610 | 1540 | 1120 | 1200 | 2516.67 |
| 1938 | 2480 | 2750 | 1660 | 1320 | 1240 | 1980 | 2190 | 2080 | 2000 | 1450 | 1340 | 1480 | 1830.83 |
| 1939 | 3160 | 2080 | 2830 | 2860 | 2730 | 2310 | 2330 | 2270 | 1990 | 3360 | 4310 | 4470 | 2891.67 |
| 1940 | 1530 | 2500 | 4020 | 3420 | 2090 | 2140 | 2650 | 2350 | 2590 | 2790 | 3600 | 2480 | 2680 |
| 1941 | 3770 | 3840 | 3430 | 3280 | 2140 | 3190 | 2220 | 2340 | 2010 | 1850 | 2590 | 2390 | 2754.17 |
| 1942 | 1700 | 1350 | 4200 | 2550 | 1660 | 2170 | 2010 | 1640 | 1150 | 1420 | 1690 | 1570 | 1925.83 |
| 1943 | 1900 | 2240 | 1410 | 1890 | 1550 | 1900 | 1570 | 1200 | 980 | 1020 | 960 | 1460 | 1506.67 |
| 1944 | 2080 | 2480 | 1920 | 2350 | 1610 | 1780 | 1920 | 1500 | 1490 | 1900 | 4040 | 5090 | 2346.67 |
| 1945 | 1620 | 5310 | 2460 | 2230 | 2510 | 2130 | 1780 | 1960 | 1800 | 1660 | 1450 | 1450 | 2196.67 |
| 1946 | 2060 | 4800 | 2990 | 1790 | 1540 | 2420 | 2510 | 1680 | 1820 | 1290 | 1160 | 1360 | 2118.33 |
| 1947 | 1450 | 1450 | 4050 | 2690 | 1620 | 1330 | 1220 | 1020 | 820 | 690 | 990 | 1880 | 1600.83 |
| 1948 | 6060 | 4580 | 1900 | 1680 | 1400 | 1460 | 3450 | 2650 | 1830 | 1130 | 1220 | 1030 | 2365.83 |
| 1949 | 1380 | 1200 | 1750 | 1550 | 1580 | 1830 | 1040 | 830 | 800 | 720 | 770 | 1500 | 1245.83 |
| 1950 | 1430 | 2450 | 1830 | 1680 | 2050 | 1820 | 1430 | 1320 | 1640 | 1320 | 2640 | 3600 | 1934.17 |
| 1951 | 3800 | 2630 | 2840 | 2930 | 2110 | 2500 | 2530 | 2020 | 1520 | 1110 | 1700 | 2110 | 2316.67 |
| 1952 | 3170 | 2460 | 3350 | 4060 | 2070 | 1740 | 1450 | 1060 | 1190 | 1850 | 3990 | 5410 | 2650 |
| 1953 | 2390 | 2740 | 2080 | 1810 | 1480 | 2160 | 3210 | 1910 | 1130 | 1010 | 1000 | 810 | 1810.83 |
| 1954 | 1520 | 1740 | 1550 | 1820 | 1400 | 1630 | 2330 | 2190 | 2330 | 2940 | 2020 | 3290 | 2063.33 |
| 1955 | 4650 | 3740 | 2720 | 2560 | 2000 | 2550 | 2570 | 2310 | 1780 | 1310 | 1030 | 1630 | 2404.17 |
| 1956 | 2840 | 1880 | 3110 | 2180 | 1880 | 2490 | 2910 | 2610 | 2790 | 2410 | 2220 | 2590 | 2492.5 |
| 1957 | 1960 | 3550 | 3780 | 2140 | 1520 | 1780 | 2040 | 2150 | 2320 | 2080 | 1360 | 1500 | 2181.67 |
| 1958 | 2500 | 4690 | 3920 | 2420 | 3280 | 2610 | 2510 | 2300 | 1710 | 2010 | 2220 | 2320 | 2707.5 |
| 1959 | 3970 | 2060 | 1810 | 1790 | 1890 | 1580 | 1690 | 1360 | 960 | 780 | 900 | 960 | 1645.83 |
| 1960 | 1920 | 1780 | 2270 | 1310 | 1400 | 1670 | 1830 | 2570 | 2410 | 2670 | 3300 | 3290 | 2201.67 |
| 1961 | 2790 | 4480 | 2180 | 2300 | 2560 | 3460 | 2360 | 2290 | 1580 | 1280 | 1610 | 3040 | 2494.17 |
| 1962 | 3060 | 3930 | 2360 | 4150 | 2690 | 2200 | 1810 | 1530 | 1260 | 960 | 850 | 1380 | 2181.67 |
| 1963 | 1050 | 870 | 2500 | 2440 | 2020 | 2220 | 2010 | 1710 | 1790 | 2530 | 1650 | 1650 | 1870 |
| 1964 | 1060 | 1490 | 1690 | 2050 | 2120 | 1620 | 1120 | 970 | 1010 | 1150 | 1740 | 1920 | 1495 |
| 1965 | 2900 | 2430 | 2860 | 3540 | 4040 | 4320 | 3630 | 2580 | 2720 | 1840 | 1940 | 6470 | 3272.5 |
| 1966 | 4270 | 4440 | 3020 | 3960 | 3060 | 2560 | 3330 | 2960 | 2100 | 1550 | 2020 | 5070 | 3195 |
| 1967 | 4070 | 3070 | 3430 | 2850 | 2280 | 2800 | 2380 | 1930 | 1960 | 1730 | 1910 | 2870 | 2606.67 |
| 1968 | 4630 | 3270 | 3080 | 2720 | 2980 | 2310 | 1990 | 2720 | 3500 | 3820 | 1950 | 1690 | 2888.33 |
| 1969 | 2150 | 2510 | 3400 | 3150 | 3290 | 2800 | 2460 | 2000 | 2150 | 1150 | 1400 | 1530 | 2332.5 |
| 1970 | 1940 | 5920 | 4580 | 4430 | 4970 | 3280 | 3140 | 2610 | 2090 | 2030 | 2160 | 2210 | 3280 |
| 1971 | 1650 | 2000 | 1520 | 1540 | 1520 | 2270 | 1810 | 1360 | 1230 | 953 | 1040 | 1300 | 1516.08 |
| 1972 | 1030 | 1180 | 952 | 1830 | 1620 | 1920 | 1900 | 1780 | 1280 | 924 | 2390 | 2070 | 1573 |
| 1973 | 1100 | 1790 | 1740 | 2160 | 2420 | 1910 | 1950 | 1720 | 1160 | 1410 | 1710 | 2670 | 1811.67 |
| 1974 | 2310 | 2640 | 2150 | 1560 | 1380 | 1670 | 2120 | 1710 | 1390 | 2440 | 3010 | 4950 | 2277.5 |
| 1975 | 3590 | 2850 | 1910 | 2830 | 2060 | 2200 | 2690 | 2020 | 2100 | 1450 | 1440 | 1640 | 2231.67 |
| 1976 | 2380 | 1880 | 1370 | 1170 | 1210 | 1330 | 1013 | 1183 | 1076 | 1120 | 1040 | 1870 | 1386.83 |
| 1977 | 1740 | 4570 | 2550 | 2400 | 2670 | 2060 | 1930 | 2160 | 1700 | 1170 | 2520 | 2300 | 2314.17 |
| 1978 | 2450 | 2500 | 4080 | 2870 | 3290 | 2920 | 2850 | 2350 | 1600 | 1570 | 1160 | 1510 | 2429.17 |
| 1979 | 2390 | 4240 | 4160 | 3140 | 2630 | 2620 | 1760 | 1600 | 1380 | 1270 | 2260 | 3560 | 2584.17 |
| 1980 | 2510 | 4640 | 1850 | 2560 | 2180 | 2320 | 4650 | 2580 | 1730 | 1660 | 1750 | 2600 | 2585.83 |
| 1981 | 3310 | 3050 | 3990 | 2750 | 2190 | 2460 | 2250 | 2300 | 1600 | 3600 | 2920 | 5160 | 2965 |
| 1982 | 5190 | 3800 | 2780 | 2410 | 2120 | 2490 | 2330 | 2170 | 1610 | 2530 | 2090 | 3900 | 2785 |
| 1983 | 3540 | 3220 | 3040 | 5100 | 4230 | 3710 | 2050 | 1550 | 1640 | 1320 | 1040 | 1780 | 2685 |
| 1984 | 3000 | 4210 | 1750 | 2380 | 2270 | 3240 | 2050 | 1780 | 2430 | 2800 | 2030 | 2060 | 2500 |
| |
|
|
|
|
|
|
|
|
|
|
|
|
|
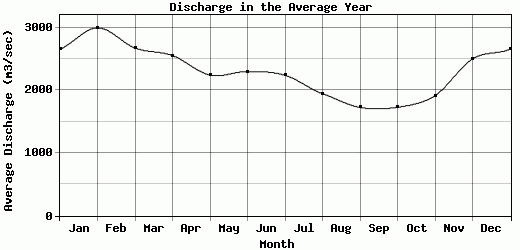
| Avg | 2656.53 | 2998.16 | 2675.96 | 2556.12 | 2243.47 | 2302.24 | 2241.08 | 1947.41 | 1728.29 | 1730.76 | 1915.71 | 2502.24 | 2291.5 |
| |
|
|
|
|
|
|
|
|
|
|
|
|
|
| Std Dev | 1149.75 |
1208 |
941.35 |
856.84 |
792.31 |
612.3 |
684.37 |
528.5 |
549.22 |
749.98 |
870.7 |
1331.05 |
495.11 |
| |
|
|
|
|
|
|
|
|
|
|
|
|
|
| | Jan | Feb | Mar | Apr | May | Jun | Jul | Aug | Sep | Oct | Nov | Dec | Avg Annual |
Click here for this table in tab-delimited format.
Tab-delimited format will open in most table browsing software, i.e. Excel, etc.
View this station on the map.
Return to start.