Results
| Country: | U.S.A.
| | Station: | ARROYO HONDO, N. MEX. | | River: | RIO GRANDE | | Area: | 22687.06 | | Lat: | 36.53 | | Lon: | -105.71 | | Source: | USGS | | PointID: | 8268700 | | Area Units: | km2 | | Discharge Units: | m3/sec | | Starting Year: | 1937 | | Ending Year: | 1972 | | Total Years: | 36 | | Total Usable Years: | 32 | |
| |
| Year | Jan | Feb | Mar | Apr | May | Jun | Jul | Aug | Sep | Oct | Nov | Dec | Avg Annual |
|---|
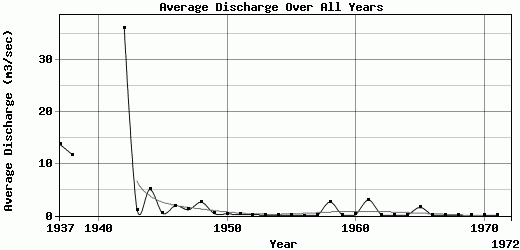
| 1937 | 0.29 | 0.47 | 0.19 | 1.73 | 44.17 | 91.22 | 10.21 | 3.61 | 12.42 | 0.12 | 0.02 | 0.27 | 13.73 |
| 1938 | 0.65 | 0.63 | 0.28 | 0.02 | 1.51 | 39.57 | 18.4 | 5.99 | 50.74 | 19.85 | 1.51 | 1.25 | 11.7 |
| 1939 | -9999 | -9999 | -9999 | -9999 | -9999 | -9999 | -9999 | -9999 | -9999 | -9999 | -9999 | -9999 | -9999 |
| 1940 | -9999 | -9999 | -9999 | -9999 | -9999 | -9999 | -9999 | -9999 | -9999 | -9999 | -9999 | -9999 | -9999 |
| 1941 | -9999 | -9999 | -9999 | -9999 | -9999 | -9999 | -9999 | -9999 | -9999 | -9999 | -9999 | -9999 | -9999 |
| 1942 | 2.34 | 2.18 | 2.15 | 171.69 | 72.17 | 6.12 | 7.1 | 13.02 | 125.56 | 16.67 | 11.41 | 4.13 | 36.21 |
| 1943 | 7.48 | 0.32 | 0.27 | 0.21 | 0.22 | 0.27 | 3.48 | 0.25 | 0.22 | 0.2 | 0.22 | 0.26 | 1.12 |
| 1944 | 0.24 | 0.33 | 0.44 | 0.47 | 16.52 | 12.63 | 5.07 | 15.14 | 9.16 | 0.11 | 0.23 | 0.21 | 5.05 |
| 1945 | 0.19 | 0.22 | 0.59 | 1.17 | 1.04 | 1.01 | 0.22 | 0.23 | 0.17 | 0.19 | 0.2 | 0.21 | 0.45 |
| 1946 | 0.22 | 0.18 | 0.21 | 0.23 | 0.21 | 0.17 | 0.21 | 0.21 | 5.76 | 14.69 | 0.6 | 0.42 | 1.93 |
| 1947 | 0.51 | 0.3 | 0.27 | 0.27 | 1.32 | 0.33 | 9.66 | 0.28 | 0.27 | 0.23 | 0.23 | 0.25 | 1.16 |
| 1948 | 0.21 | 0.23 | 0.51 | 0.76 | 0.53 | 26.73 | 0.33 | 0.39 | 0.31 | 0.36 | 0.32 | 0.4 | 2.59 |
| 1949 | 0.42 | 0.44 | 0.41 | 0.38 | 0.28 | 0.33 | 0.22 | 1.26 | 0.29 | 0.28 | 0.34 | 0.36 | 0.42 |
| 1950 | 0.37 | 0.34 | 0.33 | 0.33 | 0.33 | 0.35 | 0.37 | 0.26 | 0.24 | 0.27 | 0.33 | 0.33 | 0.32 |
| 1951 | 0.28 | 0.23 | 0.23 | 0.22 | 0.24 | 0.23 | 0.29 | 0.23 | 0.27 | 0.19 | 0.19 | 0.23 | 0.24 |
| 1952 | 0.2 | 0.12 | 0.06 | 0.06 | 0.07 | 0.09 | 0.11 | 0.21 | 0.61 | 0.15 | 0.23 | 0.19 | 0.17 |
| 1953 | 0.12 | 0.15 | 0.14 | 0.03 | 0.04 | 0.08 | 0.21 | 0.05 | 0.42 | 0.03 | 0.03 | 0.03 | 0.11 |
| 1954 | 0.03 | 0.03 | 0.03 | 0.03 | 0.03 | 0.03 | 0.03 | 0.04 | 0.03 | 0.03 | 0.02 | 0.18 | 0.04 |
| 1955 | 0.02 | 0 | 0 | 0 | 0.35 | 0 | 0.01 | 0 | 0.27 | 0 | 0 | 0 | 0.05 |
| 1956 | 0 | 0 | 0 | 0 | 0 | 0 | 0 | 0 | 0 | 0.01 | 0.02 | 0.02 | 0 |
| 1957 | 0 | 0.01 | 0.03 | 0.03 | 0.06 | 0.04 | 0.03 | 0.01 | 0 | 0.02 | 0.02 | 0.02 | 0.02 |
| 1958 | 0.03 | 0 | 0.01 | 0 | 10.44 | 12.72 | 1.4 | 5.22 | 1.43 | 0.07 | 0.07 | 0.06 | 2.62 |
| 1959 | 0.06 | 0.09 | 0.1 | 0.1 | 0.09 | 0.07 | 0.07 | 0.2 | 0.03 | 0.06 | 0.07 | 0.1 | 0.09 |
| 1960 | 0.09 | 0.09 | 0.09 | 0.08 | 0.07 | 0.23 | 0.12 | 0.23 | 0.09 | 0.21 | 0.56 | 1.4 | 0.27 |
| 1961 | 1.28 | 9.56 | 3.28 | 5.87 | 1.37 | 0.17 | 0.16 | 6.76 | 7.4 | 0.28 | 0.13 | 0.16 | 3.04 |
| 1962 | 0.21 | 0.88 | 0.36 | 0.14 | 0.11 | 0.08 | 0.08 | 0.09 | 0.07 | 0.06 | 0.1 | 0.1 | 0.19 |
| 1963 | 0.08 | 0.08 | 0.09 | 0.08 | 0.11 | 0.09 | 0.12 | 0.16 | 0.13 | 0.13 | 0.2 | 0.13 | 0.12 |
| 1964 | 0.2 | 0.15 | 0.17 | 0.14 | 0.13 | 0.14 | 0.17 | 0.15 | 0.14 | 0.07 | 0.14 | 0.12 | 0.14 |
| 1965 | 0.06 | 0.06 | 0.07 | 0.09 | 0.08 | 0.15 | 4.49 | 11.8 | 1.44 | 0.21 | 0.33 | 0.14 | 1.58 |
| 1966 | 0.13 | 0.16 | 0.17 | 0.11 | 0.1 | 0.11 | 0.09 | 0.11 | 0.09 | 0.1 | 0.1 | 0.09 | 0.11 |
| 1967 | 0.09 | 0.1 | 0.1 | 0.09 | 0.09 | 0.1 | 0.12 | 0.06 | 0.09 | 0.09 | 0.1 | 0.1 | 0.09 |
| 1968 | 0.1 | 0.1 | 0.09 | 0.11 | 0.11 | 0.1 | 0.19 | 0.18 | 0.12 | 0.11 | 0.11 | 0.1 | 0.12 |
| 1969 | 0.09 | 0.1 | 0.1 | 0.09 | 0.1 | 0.08 | 0.04 | 0.03 | 0.05 | 0.06 | 0.08 | 0.07 | 0.07 |
| 1970 | 0.05 | 0.06 | 0.06 | 0.07 | 0.21 | 0.09 | 0.1 | 0.09 | 0.13 | 0.11 | 0.12 | 0.09 | 0.1 |
| 1971 | 0.1 | 0.09 | 0.09 | 0.19 | 0.11 | 0.12 | 0.12 | 0.12 | 0.1 | 0.12 | 0.12 | 0.1 | 0.12 |
| 1972 | -9999 | -9999 | -9999 | -9999 | -9999 | -9999 | -9999 | -9999 | -9999 | -9999 | -9999 | -9999 | -9999 |
| |
|
|
|
|
|
|
|
|
|
|
|
|
|
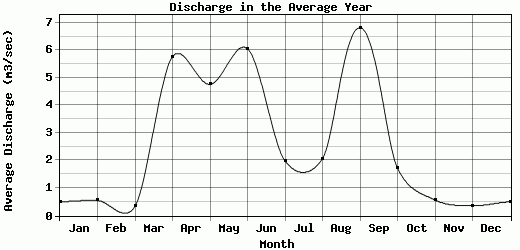
| Avg | 0.5 | 0.55 | 0.34 | 5.77 | 4.76 | 6.05 | 1.98 | 2.07 | 6.81 | 1.72 | 0.57 | 0.36 | 2.62 |
| |
|
|
|
|
|
|
|
|
|
|
|
|
|
| Std Dev | 1.33 |
1.66 |
0.65 |
29.82 |
14.6 |
17.49 |
4.04 |
4.05 |
23.17 |
4.98 |
1.97 |
0.74 |
6.79 |
| |
|
|
|
|
|
|
|
|
|
|
|
|
|
| | Jan | Feb | Mar | Apr | May | Jun | Jul | Aug | Sep | Oct | Nov | Dec | Avg Annual |
Click here for this table in tab-delimited format.
Tab-delimited format will open in most table browsing software, i.e. Excel, etc.
View this station on the map.
Return to start.