Results
| Country: | U.S.A.
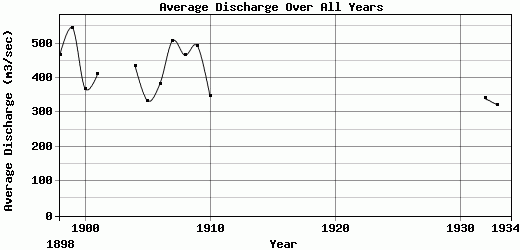
| | Station: | ROANOKE RAPIDS, N.C. | | River: | ROANOKE RIVER | | Area: | 21718.45 | | Lat: | 36.46 | | Lon: | -77.63 | | Source: | USGS | | PointID: | 2080500 | | Area Units: | km2 | | Discharge Units: | m3/sec | | Starting Year: | 1898 | | Ending Year: | 1934 | | Total Years: | 37 | | Total Usable Years: | 15 | |
| |
| Year | Jan | Feb | Mar | Apr | May | Jun | Jul | Aug | Sep | Oct | Nov | Dec | Avg Annual |
|---|
| 1898 | 128.84 | 127.43 | 165.65 | 370.95 | 801.37 | 1928.39 | 968.44 | 351.13 | 276.09 | 230.22 | 142.72 | 115.25 | 467.21 |
| 1899 | 128.84 | 117.23 | 142.72 | 665.45 | 580.5 | 1817.95 | 2038.82 | 424.75 | 237.86 | 138.19 | 118.93 | 133.66 | 545.41 |
| 1900 | 138.19 | 130.65 | 339.26 | 340.28 | 866.32 | 1419.91 | 381.22 | 179.26 | 171.32 | 188.87 | 142.72 | 128.84 | 368.9 |
| 1901 | 110.44 | 122.33 | 336.97 | 195.1 | 1265.77 | 1166.66 | 631.47 | 288.83 | 233.05 | 230.22 | 209.26 | 138.19 | 410.69 |
| 1902 | -9999 | -9999 | -9999 | -9999 | -9999 | -9999 | -9999 | -9999 | -9999 | -9999 | -9999 | -9999 | -9999 |
| 1903 | -9999 | -9999 | -9999 | -9999 | -9999 | -9999 | -9999 | -9999 | -9999 | -9999 | -9999 | -9999 | -9999 |
| 1904 | 161.41 | 161.41 | 161.41 | 393.42 | 764.38 | 1563.38 | 949.08 | 377.37 | 234.18 | 169.87 | 155.73 | 137.34 | 435.75 |
| 1905 | 127.43 | 135.92 | 216.91 | 123.86 | 273.3 | 1358.27 | 827.68 | 314.35 | 162.86 | 167.56 | 149.91 | 141.3 | 333.28 |
| 1906 | 141.3 | 141.58 | 297.24 | 302.1 | 710.09 | 1174.87 | 718.25 | 425.91 | 249.74 | 158.97 | 151.21 | 127.43 | 383.22 |
| 1907 | 127.43 | 127.43 | 186.08 | 196.46 | 583.71 | 1507.03 | 1812.56 | 682.35 | 327.68 | 232.81 | 172.85 | 137.34 | 507.81 |
| 1908 | 135.92 | 138.75 | 184.34 | 219.73 | 602.01 | 1721.2 | 1268.6 | 463.94 | 244.18 | 269.09 | 183.78 | 155.74 | 465.61 |
| 1909 | 135.92 | 141.3 | 230.22 | 159.52 | 395.94 | 2101.78 | 1421.79 | 472 | 342.66 | 216.62 | 159.99 | 135.92 | 492.81 |
| 1910 | 155.74 | 141.59 | 532.17 | 282.08 | 808.68 | 913.13 | 440.19 | 229.05 | 205.49 | 164.73 | 155.89 | 127.43 | 346.35 |
| 1911 | -9999 | -9999 | -9999 | -9999 | -9999 | -9999 | -9999 | -9999 | -9999 | -9999 | -9999 | -9999 | -9999 |
| 1912 | -9999 | -9999 | -9999 | -9999 | -9999 | -9999 | -9999 | -9999 | -9999 | -9999 | -9999 | -9999 | -9999 |
| 1913 | -9999 | -9999 | -9999 | -9999 | -9999 | -9999 | -9999 | -9999 | -9999 | -9999 | -9999 | -9999 | -9999 |
| 1914 | -9999 | -9999 | -9999 | -9999 | -9999 | -9999 | -9999 | -9999 | -9999 | -9999 | -9999 | -9999 | -9999 |
| 1915 | -9999 | -9999 | -9999 | -9999 | -9999 | -9999 | -9999 | -9999 | -9999 | -9999 | -9999 | -9999 | -9999 |
| 1916 | -9999 | -9999 | -9999 | -9999 | -9999 | -9999 | -9999 | -9999 | -9999 | -9999 | -9999 | -9999 | -9999 |
| 1917 | -9999 | -9999 | -9999 | -9999 | -9999 | -9999 | -9999 | -9999 | -9999 | -9999 | -9999 | -9999 | -9999 |
| 1918 | -9999 | -9999 | -9999 | -9999 | -9999 | -9999 | -9999 | -9999 | -9999 | -9999 | -9999 | -9999 | -9999 |
| 1919 | -9999 | -9999 | -9999 | -9999 | -9999 | -9999 | -9999 | -9999 | -9999 | -9999 | -9999 | -9999 | -9999 |
| 1920 | -9999 | -9999 | -9999 | -9999 | -9999 | -9999 | -9999 | -9999 | -9999 | -9999 | -9999 | -9999 | -9999 |
| 1921 | -9999 | -9999 | -9999 | -9999 | -9999 | -9999 | -9999 | -9999 | -9999 | -9999 | -9999 | -9999 | -9999 |
| 1922 | -9999 | -9999 | -9999 | -9999 | -9999 | -9999 | -9999 | -9999 | -9999 | -9999 | -9999 | -9999 | -9999 |
| 1923 | -9999 | -9999 | -9999 | -9999 | -9999 | -9999 | -9999 | -9999 | -9999 | -9999 | -9999 | -9999 | -9999 |
| 1924 | -9999 | -9999 | -9999 | -9999 | -9999 | -9999 | -9999 | -9999 | -9999 | -9999 | -9999 | -9999 | -9999 |
| 1925 | -9999 | -9999 | -9999 | -9999 | -9999 | -9999 | -9999 | -9999 | -9999 | -9999 | -9999 | -9999 | -9999 |
| 1926 | -9999 | -9999 | -9999 | -9999 | -9999 | -9999 | -9999 | -9999 | -9999 | -9999 | -9999 | -9999 | -9999 |
| 1927 | -9999 | -9999 | -9999 | -9999 | -9999 | -9999 | -9999 | -9999 | -9999 | -9999 | -9999 | -9999 | -9999 |
| 1928 | -9999 | -9999 | -9999 | -9999 | -9999 | -9999 | -9999 | -9999 | -9999 | -9999 | -9999 | -9999 | -9999 |
| 1929 | -9999 | -9999 | -9999 | -9999 | -9999 | -9999 | -9999 | -9999 | -9999 | -9999 | -9999 | -9999 | -9999 |
| 1930 | -9999 | -9999 | -9999 | -9999 | -9999 | -9999 | -9999 | -9999 | -9999 | -9999 | -9999 | -9999 | -9999 |
| 1931 | -9999 | -9999 | -9999 | -9999 | -9999 | -9999 | -9999 | -9999 | -9999 | -9999 | -9999 | -9999 | -9999 |
| 1932 | 92.54 | 96.31 | 194.67 | 250.46 | 707.42 | 1216.78 | 694.81 | 186.21 | 205.34 | 189.64 | 158.41 | 93.19 | 340.48 |
| 1933 | 101.72 | 95.18 | 340.85 | 208.2 | 553.92 | 1352.14 | 386.23 | 190.8 | 213.93 | 156.54 | 164.13 | 95.36 | 321.58 |
| 1934 | -9999 | -9999 | -9999 | -9999 | -9999 | -9999 | -9999 | -9999 | -9999 | -9999 | -9999 | -9999 | -9999 |
| |
|
|
|
|
|
|
|
|
|
|
|
|
|
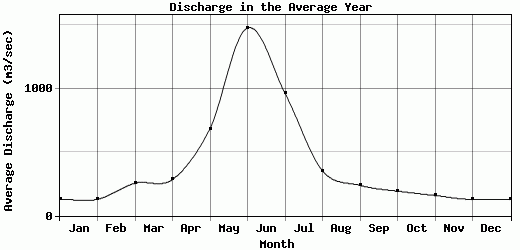
| Avg | 129.67 | 129.01 | 256.04 | 285.2 | 685.65 | 1480.11 | 964.55 | 352.77 | 238.8 | 193.33 | 158.89 | 128.23 | 416.85 |
| |
|
|
|
|
|
|
|
|
|
|
|
|
|
| Std Dev | 18.63 |
17.68 |
105.46 |
134.8 |
232.83 |
326.33 |
510.48 |
139.03 |
50.72 |
37.42 |
20.86 |
17.01 |
71.35 |
| |
|
|
|
|
|
|
|
|
|
|
|
|
|
| | Jan | Feb | Mar | Apr | May | Jun | Jul | Aug | Sep | Oct | Nov | Dec | Avg Annual |
Click here for this table in tab-delimited format.
Tab-delimited format will open in most table browsing software, i.e. Excel, etc.
View this station on the map.
Return to start.