Results
| Country: | U.S.A.
| | Station: | MONTEZUMA, IND. | | River: | WABASH RIVER | | Area: | 28793.91 | | Lat: | 39.79 | | Lon: | -87.37 | | Source: | USGS | | PointID: | 3340500 | | Area Units: | km2 | | Discharge Units: | m3/sec | | Starting Year: | 1940 | | Ending Year: | 1949 | | Total Years: | 10 | | Total Usable Years: | 9 | |
| |
| Year | Jan | Feb | Mar | Apr | May | Jun | Jul | Aug | Sep | Oct | Nov | Dec | Avg Annual |
|---|
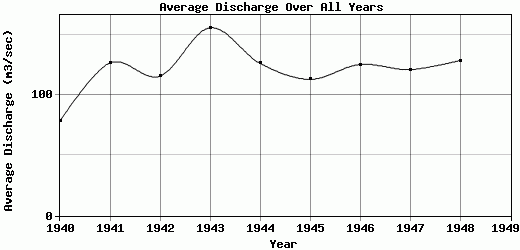
| 1940 | 35.73 | 41.41 | 75.99 | 102.74 | 80.24 | 96.36 | 117.45 | 121.7 | 90.65 | 48.64 | 54.07 | 71.84 | 78.07 |
| 1941 | 92.11 | 114.28 | 239.54 | 229.82 | 102.04 | 103.17 | 48.53 | 44.48 | 113.15 | 185.81 | 152.43 | 93.05 | 126.53 |
| 1942 | 82.44 | 91.07 | 152.98 | 115.05 | 85.71 | 150.02 | 74.35 | 147.81 | 125.43 | 82.48 | 142.18 | 135.82 | 115.45 |
| 1943 | 137.58 | 229.57 | 389.13 | 280.3 | 172.97 | 176.26 | 110.35 | 102.56 | 72.52 | 58.43 | 76.45 | 60.53 | 155.55 |
| 1944 | 56.04 | 145.64 | 392.36 | 195.02 | 179.06 | 167.11 | 95.66 | 54.83 | 58.67 | 51.96 | 63.48 | 53.45 | 126.11 |
| 1945 | 50.57 | 60.27 | 162.01 | 116.61 | 191.54 | 175.94 | 112.45 | 67.81 | 100.68 | 125.22 | 98.75 | 93.31 | 112.93 |
| 1946 | 344.37 | 114.28 | 451.92 | 186.01 | 78.79 | 64.69 | 47.89 | 42.51 | 42.15 | 40.88 | 49.24 | 40.14 | 125.24 |
| 1947 | 69.02 | 78.18 | 148.9 | 259.43 | 157.64 | 240.82 | 126.61 | 63.62 | 71.71 | 56.57 | 76.96 | 102.11 | 120.96 |
| 1948 | 54.35 | 126.82 | 509.89 | 228.54 | 237 | 81.87 | 59.65 | 51.85 | 40.55 | 42.55 | 55.53 | 53.62 | 128.52 |
| 1949 | -9999 | -9999 | -9999 | -9999 | -9999 | -9999 | -9999 | -9999 | -9999 | -9999 | -9999 | -9999 | -9999 |
| |
|
|
|
|
|
|
|
|
|
|
|
|
|
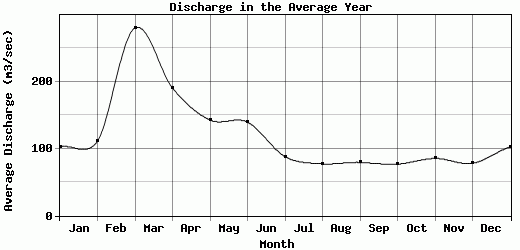
| Avg | 102.47 | 111.28 | 280.3 | 190.39 | 142.78 | 139.58 | 88.1 | 77.46 | 79.5 | 76.95 | 85.45 | 78.21 | 121.04 |
| |
|
|
|
|
|
|
|
|
|
|
|
|
|
| Std Dev | 90.06 |
52.09 |
148.11 |
62.1 |
54.39 |
53.66 |
29.19 |
35.43 |
28.42 |
45.8 |
36.07 |
28.59 |
19.04 |
| |
|
|
|
|
|
|
|
|
|
|
|
|
|
| | Jan | Feb | Mar | Apr | May | Jun | Jul | Aug | Sep | Oct | Nov | Dec | Avg Annual |
Click here for this table in tab-delimited format.
Tab-delimited format will open in most table browsing software, i.e. Excel, etc.
View this station on the map.
Return to start.