Results
| Country: | Zimbabwe
| | Station: | Condo | | River: | Sabi | | Area: | 11000 km2 | | Lat: | -19.21 | | Lon: | 32.01 | | Source: | RivDIS | | PointID: | 1323 | | Area Units: | km2 | | Discharge Units: | m3/sec | | Starting Year: | 1980 | | Ending Year: | 2009 | | Total Years: | 30 | | Total Usable Years: | 27 | |
| |
| Year | Jan | Feb | Mar | Apr | May | Jun | Jul | Aug | Sep | Oct | Nov | Dec | Avg Annual |
|---|
| 1980 | -9999 | -9999 | -9999 | -9999 | -9999 | 2.8 | 2.1 | 1.4 | 5.9 | 3.7 | 5.8 | 91.5 | -9999 |
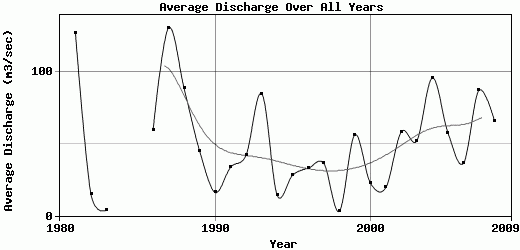
| 1981 | 315 | 781 | 198 | 65.5 | 52 | 27.5 | 17.5 | 11 | 7.7 | 3.8 | 26.5 | 21 | 127.21 |
| 1982 | 77.5 | 50 | 19.5 | 9.3 | 6 | 3.2 | 2.5 | 1.5 | 0.8 | 3.4 | 1.8 | 2.3 | 14.82 |
| 1983 | 7.8 | 10.5 | 11.5 | 0.27 | 0.14 | 0.07 | 0.19 | 0.09 | 0.04 | 0.17 | 4.2 | 12.5 | 3.96 |
| 1984 | 4.7 | 11.5 | 13.5 | 6.6 | 1.6 | 2.2 | 0.21 | 0.07 | 1.6 | -9999 | -9999 | -9999 | -9999 |
| 1985 | -9999 | -9999 | -9999 | -9999 | -9999 | -9999 | -9999 | -9999 | -9999 | 5.68 | 12.8 | 36.9 | -9999 |
| 1986 | 49.7 | 116 | 207 | 81.4 | 34.2 | 20.9 | 12.7 | 7.62 | 7.56 | 0.7 | 48.6 | 129 | 59.62 |
| 1987 | 187 | 68.6 | 111 | 45.1 | 207 | 12.9 | 9.6 | 6.76 | 4.13 | 3.99 | 11.1 | 904 | 130.93 |
| 1988 | 140 | 471 | 244 | 67.5 | 32.2 | 23.5 | 17.1 | 12.2 | 11.2 | 9.22 | 13 | 23.8 | 88.73 |
| 1989 | 203 | 156 | 67.6 | 23.1 | 14.6 | 10.8 | 7.88 | 5.53 | 3.4 | 2.51 | 9.92 | 36.6 | 45.08 |
| 1990 | 30.2 | 70.2 | 23 | 9.76 | 9.97 | 6.56 | 4.59 | 2.82 | 1.55 | 11 | 9.72 | 15.9 | 16.27 |
| 1991 | 80.6 | 91.8 | 45.5 | 87.2 | 28.1 | 15.6 | 11.6 | 7.43 | 4.05 | 1.77 | 14.6 | 18 | 33.85 |
| 1992 | 73.6 | 103 | 49.3 | 26.2 | 11.8 | 8.02 | 5.6 | 3.88 | 2.48 | 0.83 | 11.1 | 212 | 42.32 |
| 1993 | 163 | 434 | 166 | 110 | 46.7 | 29.5 | 20.9 | 13.4 | 7.91 | 7.13 | 6.71 | 16.4 | 85.14 |
| 1994 | 37.7 | 40.3 | 8.14 | 2.86 | 1.87 | 1.83 | 2.07 | 1.78 | 0.9 | 0.55 | 0.32 | 72.1 | 14.2 |
| 1995 | 195 | 65.7 | 30.4 | 11.7 | 5.82 | 4.59 | 3.52 | 2.33 | 2.05 | 2.34 | 8.22 | 7.95 | 28.3 |
| 1996 | 10.2 | 161 | 123 | 38.4 | 22 | 15.1 | 8.81 | 5.23 | 3.94 | 1.43 | 1.37 | 6.87 | 33.11 |
| 1997 | 78.8 | 134 | 118 | 37.1 | 23.1 | 12.3 | 8.85 | 5.75 | 6.06 | 3.55 | 3.39 | 6.5 | 36.45 |
| 1998 | 2.07 | 6.9 | 0.82 | 2.39 | 0.88 | 0.64 | 0.82 | 0.54 | 0.24 | 0.02 | 2.67 | 18 | 3 |
| 1999 | 93.7 | 31.2 | 169 | 127 | 34 | 15.7 | 9.82 | 6.57 | 2.95 | 9.22 | 14 | 163 | 56.35 |
| 2000 | 96.3 | 37.2 | 15.3 | 10.7 | 4.14 | 2.87 | 2.95 | 1.59 | 0.56 | 3.42 | 37.6 | 61.2 | 22.82 |
| 2001 | 122 | 34.4 | 13.2 | 5.98 | 4.11 | 2.69 | 1.89 | 6.2 | 2.21 | 4.26 | 22.3 | 15.7 | 19.58 |
| 2002 | 104 | 272 | 114 | 103 | 38.5 | 17.9 | 13.6 | 9.78 | 6.56 | 6.72 | 9.61 | 7.99 | 58.64 |
| 2003 | 9.26 | 19 | 4.55 | 1.1 | 2.26 | 2.17 | 2.41 | 2.63 | 0.4 | 422 | 35.1 | 125 | 52.16 |
| 2004 | 176 | 303 | 175 | 69.1 | 51.5 | 22.6 | 21.1 | 12 | 6.4 | 3.73 | 26.1 | 286 | 96.04 |
| 2005 | 193 | 224 | 99.7 | 64.4 | 31.7 | 19.4 | 12.5 | 9.37 | 5.21 | 5.38 | 5.36 | 24 | 57.84 |
| 2006 | 30.6 | 82.2 | 112 | 89.9 | 38.5 | 22 | 13.6 | 8.06 | 4.63 | 6.8 | 11.8 | 17.1 | 36.43 |
| 2007 | 15.7 | 283 | 489 | 96.8 | 35.9 | 21.3 | 16 | 11.5 | 9.07 | 8.59 | 5.94 | 56 | 87.4 |
| 2008 | 175 | 155 | 175 | 84.5 | 37.1 | 23.4 | 16.1 | 9.63 | 5.17 | 11.7 | 7.41 | 92.6 | 66.05 |
| 2009 | 2.66 | -9999 | -9999 | -9999 | -9999 | -9999 | -9999 | -9999 | -9999 | -9999 | -9999 | -9999 | -9999 |
| |
|
|
|
|
|
|
|
|
|
|
|
|
|
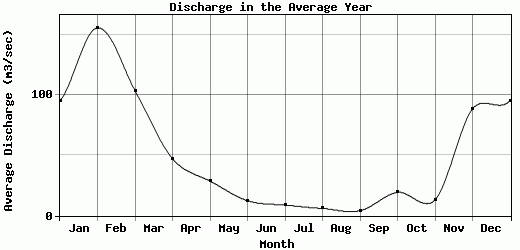
| Avg | 95.5 | 156.02 | 103.82 | 47.29 | 28.73 | 12.43 | 8.8 | 5.95 | 4.1 | 19.41 | 13.11 | 88.57 | 50.63 |
| |
|
|
|
|
|
|
|
|
|
|
|
|
|
| Std Dev | 79.56 |
173.5 |
104.64 |
39.29 |
38.72 |
9.08 |
6.42 |
4.02 |
2.92 |
77.54 |
11.64 |
170.98 |
34.2 |
| |
|
|
|
|
|
|
|
|
|
|
|
|
|
| | Jan | Feb | Mar | Apr | May | Jun | Jul | Aug | Sep | Oct | Nov | Dec | Avg Annual |
Click here for this table in tab-delimited format.
Tab-delimited format will open in most table browsing software, i.e. Excel, etc.
View this station on the map.
Return to start.