Results
| Country: | U.S.A.
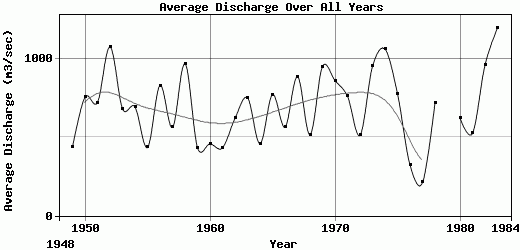
| | Station: | Sacramento,California | | River: | Sacramento | | Area: | 60886 km2 | | Lat: | 38.58 | | Lon: | -121.5 | | Source: | RivDIS | | PointID: | 351 | | Area Units: | km2 | | Discharge Units: | m3/sec | | Starting Year: | 1948 | | Ending Year: | 1984 | | Total Years: | 37 | | Total Usable Years: | 35 | |
| |
| Year | Jan | Feb | Mar | Apr | May | Jun | Jul | Aug | Sep | Oct | Nov | Dec | Avg Annual |
|---|
| 1948 | -9999 | -9999 | -9999 | -9999 | -9999 | -9999 | -9999 | -9999 | -9999 | 283 | 314 | 368 | -9999 |
| 1949 | 344 | 396 | 1321 | 893 | 711 | 289 | 179 | 199 | 239 | 199 | 246 | 229 | 437.08 |
| 1950 | 706 | 1143 | 891 | 1083 | 861 | 508 | 226 | 204 | 253 | 285 | 1042 | 1891 | 757.75 |
| 1951 | 1467 | 1762 | 1122 | 764 | 790 | 305 | 241 | 271 | 284 | 269 | 384 | 1013 | 722.67 |
| 1952 | 1776 | 1857 | 1665 | 1922 | 1977 | 1189 | 511 | 294 | 322 | 280 | 297 | 833 | 1076.92 |
| 1953 | 1795 | 937 | 713 | 842 | 1022 | 892 | 310 | 247 | 342 | 302 | 385 | 405 | 682.67 |
| 1954 | 772 | 1564 | 1370 | 1417 | 703 | 312 | 229 | 261 | 315 | 299 | 412 | 670 | 693.67 |
| 1955 | 644 | 427 | 386 | 390 | 611 | 345 | 254 | 255 | 278 | 224 | 284 | 1122 | 435 |
| 1956 | 2098 | 1516 | 1340 | 909 | 1202 | 721 | 351 | 333 | 389 | 350 | 413 | 354 | 831.33 |
| 1957 | 340 | 505 | 1411 | 566 | 877 | 475 | 264 | 275 | 345 | 515 | 531 | 654 | 563.17 |
| 1958 | 992 | 2049 | 1710 | 2020 | 1518 | 993 | 407 | 402 | 451 | 358 | 370 | 360 | 969.17 |
| 1959 | 774 | 1146 | 767 | 394 | 323 | 226 | 298 | 338 | 308 | 224 | 207 | 204 | 434.08 |
| 1960 | 314 | 1006 | 954 | 545 | 455 | 307 | 294 | 275 | 273 | 217 | 331 | 523 | 457.83 |
| 1961 | 366 | 1096 | 805 | 479 | 371 | 309 | 298 | 324 | 274 | 200 | 233 | 444 | 433.25 |
| 1962 | 298 | 1217 | 1070 | 799 | 559 | 368 | 290 | 326 | 342 | 812 | 472 | 903 | 621.33 |
| 1963 | 546 | 1588 | 691 | 1745 | 1211 | 498 | 343 | 324 | 459 | 401 | 641 | 594 | 753.42 |
| 1964 | 700 | 591 | 407 | 354 | 395 | 314 | 329 | 344 | 374 | 275 | 393 | 1035 | 459.25 |
| 1965 | 2033 | 1302 | 653 | 1195 | 852 | 454 | 344 | 409 | 437 | 395 | 571 | 640 | 773.75 |
| 1966 | 978 | 765 | 670 | 615 | 402 | 271 | 328 | 348 | 310 | 258 | 527 | 1314 | 565.5 |
| 1967 | 1022 | 1465 | 1184 | 1426 | 1470 | 1218 | 552 | 426 | 526 | 457 | 413 | 486 | 887.08 |
| 1968 | 573 | 1110 | 1010 | 404 | 370 | 317 | 352 | 364 | 367 | 325 | 380 | 642 | 517.83 |
| 1969 | 1550 | 2010 | 1390 | 1270 | 1140 | 647 | 398 | 514 | 589 | 467 | 474 | 987 | 953 |
| 1970 | 1970 | 1850 | 1240 | 410 | 400 | 330 | 369 | 420 | 518 | 427 | 630 | 1790 | 862.83 |
| 1971 | 1460 | 874 | 850 | 1070 | 817 | 770 | 587 | 529 | 682 | 450 | 443 | 610 | 761.83 |
| 1972 | 560 | 620 | 670 | 370 | 360 | 387 | 420 | 438 | 470 | 450 | 649 | 767 | 513.42 |
| 1973 | 1700 | 1850 | 1460 | 585 | 465 | 423 | 430 | 457 | 495 | 474 | 1360 | 1740 | 953.25 |
| 1974 | 2120 | 1480 | 1830 | 1880 | 826 | 691 | 616 | 678 | 710 | 570 | 623 | 726 | 1062.5 |
| 1975 | 550 | 1350 | 1440 | 939 | 857 | 671 | 518 | 552 | 577 | 543 | 613 | 723 | 777.75 |
| 1976 | 424 | 358 | 408 | 356 | 306 | 306 | 338 | 374 | 350 | 227 | 219 | 217 | 323.58 |
| 1977 | 274 | 224 | 184 | 167 | 213 | 192 | 231 | 215 | 192 | 126 | 187 | 329 | 211.17 |
| 1978 | 1270 | 1250 | 1560 | 1090 | 705 | 355 | 400 | 447 | 502 | 350 | 348 | 370 | 720.58 |
| 1979 | 649 | 908 | 817 | 463 | 504 | 342 | 460 | 439 | 408 | -9999 | -9999 | -9999 | -9999 |
| 1980 | 1466 | 1311 | 1411 | 472 | 335 | 422 | 382 | 364 | 381 | 272 | 264 | 390 | 622.5 |
| 1981 | 475 | 628 | 652 | 443 | 324 | 221 | 392 | 374 | 318 | 223 | 778 | 1475 | 525.25 |
| 1982 | 1504 | 1388 | 1506 | 1759 | 926 | 533 | 412 | 483 | 592 | 451 | 692 | 1284 | 960.83 |
| 1983 | 1101 | 1905 | 2019 | 1473 | 1430 | 1098 | 695 | 606 | 601 | 522 | 1119 | 1824 | 1199.42 |
| 1984 | 1408 | 778 | 759 | 432 | 365 | 351 | 504 | 477 | 445 | -9999 | -9999 | -9999 | -9999 |
| |
|
|
|
|
|
|
|
|
|
|
|
|
|
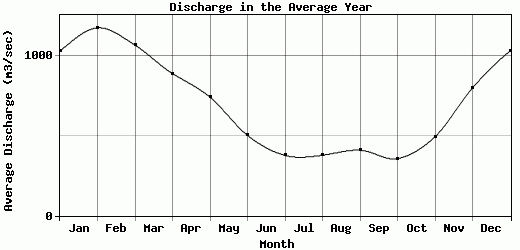
| Avg | 1028.31 | 1172.94 | 1064.89 | 887.25 | 740.36 | 501.39 | 376.44 | 377.39 | 408.83 | 356.57 | 492.71 | 797.6 | 691.78 |
| |
|
|
|
|
|
|
|
|
|
|
|
|
|
| Std Dev | 584.45 |
504.66 |
442.72 |
520.3 |
410.92 |
274.79 |
117.22 |
111.5 |
127.26 |
137.09 |
259 |
481.68 |
231.16 |
| |
|
|
|
|
|
|
|
|
|
|
|
|
|
| | Jan | Feb | Mar | Apr | May | Jun | Jul | Aug | Sep | Oct | Nov | Dec | Avg Annual |
Click here for this table in tab-delimited format.
Tab-delimited format will open in most table browsing software, i.e. Excel, etc.
View this station on the map.
Return to start.