Results
| Country: | U.S.A.
| | Station: | RUSH CITY, MN | | River: | ST. CROIX RIVER | | Area: | 18206633.77 | | Lat: | 45.7 | | Lon: | -92.87 | | Source: | USGS | | PointID: | 5339500 | | Area Units: | km2 | | Discharge Units: | m3/sec | | Starting Year: | 1912 | | Ending Year: | 1925 | | Total Years: | 14 | | Total Usable Years: | 12 | |
| |
| Year | Jan | Feb | Mar | Apr | May | Jun | Jul | Aug | Sep | Oct | Nov | Dec | Avg Annual |
|---|
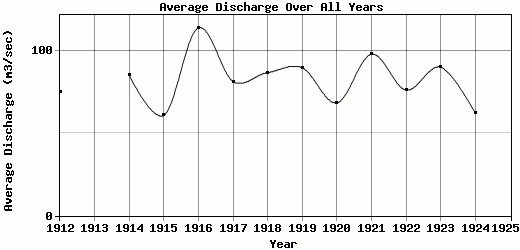
| 1912 | 28.88 | 28.45 | 24.61 | 43.21 | 229.88 | 215.96 | 116.15 | 61.1 | 44.9 | 35.6 | 36.35 | 32.03 | 74.76 |
| 1913 | -9999 | -9999 | -9999 | -9999 | -9999 | -9999 | -9999 | -9999 | -9999 | -9999 | -9999 | -9999 | -9999 |
| 1914 | 42.97 | 34.72 | 35.38 | 94.24 | 268.48 | 244.81 | 112.88 | 45.66 | 32.85 | 36.46 | 42.59 | 31.46 | 85.21 |
| 1915 | 27.53 | 30.26 | 30.5 | 89.98 | 153.41 | 129.78 | 75.7 | 53.76 | 33.48 | 33.76 | 40.52 | 29.77 | 60.7 |
| 1916 | 21.83 | 31.67 | 52.73 | 80.68 | 272.9 | 439.2 | 247.12 | 84.25 | 48.34 | 34.14 | 27.98 | 23.8 | 113.72 |
| 1917 | 22.5 | 22.89 | 24.43 | 25.07 | 169.4 | 372.27 | 163.9 | 52.33 | 32.21 | 28.76 | 33.05 | 28.33 | 81.26 |
| 1918 | 65.72 | 33.31 | 27.72 | 66.09 | 259.63 | 322.1 | 103.1 | 51.07 | 26.28 | 28.97 | 30.58 | 25.21 | 86.65 |
| 1919 | 26.5 | 24.28 | 25.59 | 67.36 | 286.15 | 330.8 | 151.1 | 49.71 | 30.37 | 24.16 | 32.82 | 25.58 | 89.54 |
| 1920 | 24.57 | 31.01 | 22.31 | 23.9 | 134.19 | 234.88 | 162.69 | 47.57 | 26.77 | 52.82 | 33.42 | 25.39 | 68.29 |
| 1921 | 23.15 | 26.03 | 33.04 | 49.7 | 278.37 | 412.22 | 144.83 | 45.32 | 23.32 | 34.75 | 46.51 | 56.33 | 97.8 |
| 1922 | 45.48 | 36.6 | 38.98 | 43.83 | 198.12 | 337.58 | 73.96 | 27.79 | 23.11 | 27.95 | 31.39 | 27.72 | 76.04 |
| 1923 | 36.36 | 27.92 | 29.1 | 66.39 | 256.17 | 331.88 | 148.33 | 53.06 | 34.46 | 33.33 | 32.74 | 29.52 | 89.94 |
| 1924 | 24.3 | 46.92 | 37.53 | 40.7 | 288.87 | 151.14 | 45.35 | 17.81 | 12.79 | 21.38 | 22.82 | 34.84 | 62.04 |
| 1925 | -9999 | -9999 | -9999 | -9999 | -9999 | -9999 | -9999 | -9999 | -9999 | -9999 | -9999 | -9999 | -9999 |
| |
|
|
|
|
|
|
|
|
|
|
|
|
|
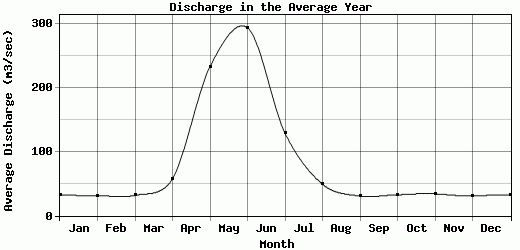
| Avg | 32.48 | 31.17 | 31.83 | 57.6 | 232.96 | 293.55 | 128.76 | 49.12 | 30.74 | 32.67 | 34.23 | 30.83 | 82.16 |
| |
|
|
|
|
|
|
|
|
|
|
|
|
|
| Std Dev | 12.59 |
6.17 |
8.15 |
22.56 |
52.81 |
94 |
51.14 |
15.53 |
9.17 |
7.57 |
6.2 |
8.29 |
14.54 |
| |
|
|
|
|
|
|
|
|
|
|
|
|
|
| | Jan | Feb | Mar | Apr | May | Jun | Jul | Aug | Sep | Oct | Nov | Dec | Avg Annual |
Click here for this table in tab-delimited format.
Tab-delimited format will open in most table browsing software, i.e. Excel, etc.
View this station on the map.
Return to start.