Results
| Country: | U.S.A.
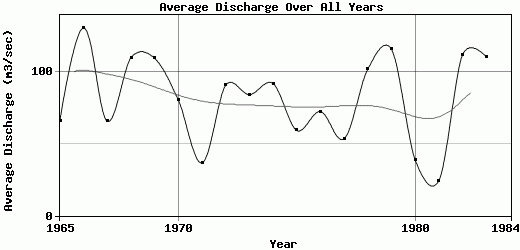
| | Station: | Deland,Florida | | River: | St.Johns | | Area: | 7941 km2 | | Lat: | 29.01 | | Lon: | -81.38 | | Source: | RivDIS | | PointID: | 404 | | Area Units: | km2 | | Discharge Units: | m3/sec | | Starting Year: | 1965 | | Ending Year: | 1984 | | Total Years: | 20 | | Total Usable Years: | 19 | |
| |
| Year | Jan | Feb | Mar | Apr | May | Jun | Jul | Aug | Sep | Oct | Nov | Dec | Avg Annual |
|---|
| 1965 | 62 | 49 | 78 | 48 | 36 | 33 | 88 | 108 | 53 | 81 | 88 | 68 | 66 |
| 1966 | 64 | 97 | 183 | 144 | 57 | 111 | 192 | 187 | 148 | 176 | 120 | 87 | 130.5 |
| 1967 | 52 | 53 | 46 | 23 | 15 | 29 | 100 | 150 | 142 | 104 | 45 | 28 | 65.58 |
| 1968 | 25.5 | 27 | 49 | 12.5 | 19 | 185 | 329 | 188 | 102 | 103 | 168 | 108 | 109.67 |
| 1969 | 75 | 55.5 | 84 | 94 | 44.5 | 52 | 51 | 94 | 138 | 196 | 225 | 203 | 109.33 |
| 1970 | 189 | 180 | 146 | 92.5 | 47 | 36 | 46 | 68 | 47 | 40 | 46 | 25 | 80.21 |
| 1971 | 36 | 54 | 22 | 25 | 11.5 | 17 | 44 | 50 | 19.5 | 42 | 57 | 62.5 | 36.71 |
| 1972 | 415 | 66 | 48 | 62 | 24.5 | 59 | 81 | 71 | 99.5 | 42.5 | 45 | 74 | 90.63 |
| 1973 | 74.5 | 108 | 80.5 | 62 | 39 | 32.5 | 58.5 | 98.5 | 124 | 123 | 121 | 88 | 84.13 |
| 1974 | 55 | 24.5 | 19 | 20 | 5.72 | 25 | 183 | 228 | 189 | 191 | 111 | 50 | 91.77 |
| 1975 | 26 | 17.5 | 16.5 | 17 | 24 | 35 | 86 | 105 | 100 | 113 | 103 | 68 | 59.25 |
| 1976 | 50 | 34 | 15 | 17 | 34 | 85 | 111 | 112 | 135 | 120 | 90 | 65 | 72.33 |
| 1977 | 75 | 70 | 44 | 33 | 22 | 40 | 36 | 50 | 80 | 65 | 50 | 75 | 53.33 |
| 1978 | 90 | 108 | 158 | 75 | 49 | 55 | 95 | 180 | 163 | 109 | 75 | 65 | 101.83 |
| 1979 | 111 | 112 | 116 | 55 | 65 | 60 | 85 | 100 | 160 | 244 | 179 | 100 | 115.58 |
| 1980 | 57.5 | 55 | 70.5 | 58.5 | 33 | 33 | 22.5 | 18 | 24.5 | 13.5 | 71 | 6.5 | 38.63 |
| 1981 | 40.5 | 32 | 31 | 18.5 | 8 | 10 | 13.5 | 25.5 | 46.5 | 12.5 | 31 | 23 | 24.33 |
| 1982 | 41.5 | 16.5 | 25.5 | 121 | 69 | 113 | 220 | 206 | 175 | 166 | 113 | 75 | 111.79 |
| 1983 | 49 | 129 | 190 | 218 | 146 | 75.5 | 84 | 87.5 | 68 | 78 | 98 | 102 | 110.42 |
| 1984 | 128 | 122 | 95.5 | 91.5 | 81 | 56 | -9999 | -9999 | -9999 | -9999 | -9999 | -9999 | -9999 |
| |
|
|
|
|
|
|
|
|
|
|
|
|
|
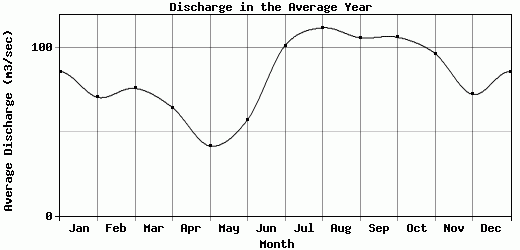
| Avg | 85.83 | 70.5 | 75.88 | 64.38 | 41.51 | 57.1 | 101.34 | 111.92 | 106 | 106.29 | 96.63 | 72.26 | 81.69 |
| |
|
|
|
|
|
|
|
|
|
|
|
|
|
| Std Dev | 84.29 |
43.23 |
54.59 |
50.78 |
31.45 |
40.12 |
76.52 |
60.13 |
50.9 |
63.37 |
49.84 |
41.16 |
29.45 |
| |
|
|
|
|
|
|
|
|
|
|
|
|
|
| | Jan | Feb | Mar | Apr | May | Jun | Jul | Aug | Sep | Oct | Nov | Dec | Avg Annual |
Click here for this table in tab-delimited format.
Tab-delimited format will open in most table browsing software, i.e. Excel, etc.
View this station on the map.
Return to start.