Results
| Country: | Canada
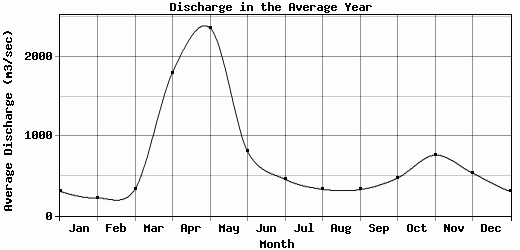
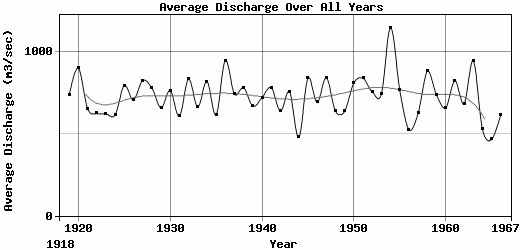
| | Station: | Pokiok | | River: | St.John | | Area: | 38800 km2 | | Lat: | 45.96 | | Lon: | -67.23 | | Source: | RivDIS | | PointID: | 322 | | Area Units: | km2 | | Discharge Units: | m3/sec | | Starting Year: | 1918 | | Ending Year: | 1967 | | Total Years: | 50 | | Total Usable Years: | 49 | |
| |
| Year | Jan | Feb | Mar | Apr | May | Jun | Jul | Aug | Sep | Oct | Nov | Dec | Avg Annual |
|---|
| 1918 | -9999 | -9999 | -9999 | -9999 | -9999 | -9999 | -9999 | -9999 | 403 | 614 | 933 | 365 | -9999 |
| 1919 | 281 | 186 | 373 | 2390 | 3200 | 704 | 226 | 225 | 268 | 274 | 449 | 268 | 737 |
| 1920 | 110 | 75.5 | 186 | 2400 | 2700 | 692 | 918 | 285 | 737 | 1150 | 1050 | 552 | 904.63 |
| 1921 | 326 | 165 | 918 | 2700 | 1220 | 255 | 142 | 354 | 201 | 728 | 483 | 368 | 655 |
| 1922 | 265 | 153 | 365 | 1900 | 1220 | 1990 | 834 | 215 | 136 | 145 | 172 | 109 | 625.33 |
| 1923 | 171 | 127 | 103 | 876 | 3310 | 509 | 197 | 140 | 140 | 287 | 691 | 925 | 623 |
| 1924 | 259 | 184 | 127 | 617 | 3990 | 726 | 230 | 159 | 233 | 227 | 295 | 351 | 616.5 |
| 1925 | 107 | 149 | 375 | 1850 | 2160 | 643 | 409 | 290 | 223 | 1010 | 1610 | 718 | 795.33 |
| 1926 | 261 | 122 | 96.8 | 350 | 3600 | 1060 | 330 | 157 | 277 | 495 | 1270 | 485 | 708.65 |
| 1927 | 229 | 115 | 220 | 1820 | 1610 | 1110 | 376 | 436 | 218 | 656 | 2510 | 621 | 826.75 |
| 1928 | 456 | 258 | 190 | 1530 | 3290 | 1160 | 466 | 430 | 284 | 401 | 504 | 410 | 781.58 |
| 1929 | 378 | 247 | 163 | 1460 | 3050 | 865 | 447 | 220 | 140 | 345 | 410 | 200 | 660.42 |
| 1930 | 355 | 202 | 429 | 1710 | 2960 | 1020 | 746 | 528 | 309 | 233 | 378 | 310 | 765 |
| 1931 | 203 | 194 | 174 | 2020 | 1070 | 784 | 341 | 211 | 313 | 822 | 916 | 246 | 607.83 |
| 1932 | 312 | 218 | 181 | 2620 | 1830 | 594 | 538 | 544 | 692 | 886 | 1170 | 429 | 834.5 |
| 1933 | 271 | 177 | 127 | 1660 | 2920 | 832 | 468 | 157 | 217 | 449 | 442 | 265 | 665.42 |
| 1934 | 159 | 100 | 179 | 3602 | 2450 | 705 | 451 | 303 | 188 | 315 | 659 | 736 | 820.58 |
| 1935 | 356 | 234 | 226 | 1860 | 1980 | 1130 | 550 | 191 | 168 | 163 | 235 | 309 | 616.83 |
| 1936 | 262 | 164 | 2300 | 1960 | 2792 | 1040 | 370 | 250 | 335 | 659 | 755 | 492 | 948.25 |
| 1937 | 762 | 423 | 267 | 1620 | 2210 | 714 | 259 | 340 | 245 | 481 | 1010 | 601 | 744.33 |
| 1938 | 268 | 345 | 375 | 1960 | 1870 | 509 | 831 | 516 | 668 | 579 | 452 | 1010 | 781.92 |
| 1939 | 259 | 207 | 209 | 943 | 1310 | 833 | 572 | 964 | 400 | 781 | 927 | 641 | 670.5 |
| 1940 | 227 | 128 | 175 | 1500 | 2660 | 1200 | 774 | 215 | 205 | 233 | 892 | 448 | 721.42 |
| 1941 | 405 | 253 | 181 | 2580 | 1600 | 528 | 757 | 223 | 485 | 821 | 1030 | 542 | 783.75 |
| 1942 | 342 | 221 | 297 | 1730 | 2830 | 1080 | 358 | 153 | 115 | 164 | 236 | 155 | 640.08 |
| 1943 | 99.9 | 102 | 138 | 671 | 3370 | 1080 | 459 | 366 | 343 | 676 | 1500 | 281 | 757.16 |
| 1944 | 154 | 106 | 105 | 406 | 1960 | 468 | 271 | 209 | 205 | 834 | 744 | 282 | 478.67 |
| 1945 | 405 | 247 | 515 | 3490 | 1830 | 750 | 724 | 280 | 328 | 666 | 552 | 297 | 840.33 |
| 1946 | 273 | 211 | 604 | 1720 | 2990 | 543 | 285 | 257 | 160 | 291 | 496 | 496 | 693.83 |
| 1947 | 321 | 403 | 393 | 1440 | 4370 | 1500 | 630 | 445 | 198 | 140 | 146 | 128 | 842.83 |
| 1948 | 125 | 78.1 | 159 | 1600 | 2470 | 625 | 305 | 231 | 156 | 409 | 830 | 691 | 639.93 |
| 1949 | 572 | 370 | 325 | 2240 | 1340 | 693 | 348 | 164 | 244 | 219 | 437 | 709 | 638.42 |
| 1950 | 419 | 290 | 324 | 1900 | 1570 | 752 | 439 | 219 | 226 | 175 | 1200 | 2220 | 811.17 |
| 1951 | 517 | 501 | 430 | 3230 | 1330 | 575 | 904 | 412 | 317 | 280 | 872 | 711 | 839.92 |
| 1952 | 485 | 369 | 301 | 2160 | 2650 | 1450 | 273 | 146 | 102 | 368 | 423 | 355 | 756.83 |
| 1953 | 253 | 383 | 683 | 3400 | 1900 | 408 | 250 | 119 | 94.1 | 113 | 442 | 880 | 743.76 |
| 1954 | 495 | 337 | 690 | 2540 | 2160 | 1150 | 1040 | 1060 | 1160 | 1310 | 1060 | 789 | 1149.25 |
| 1955 | 511 | 611 | 604 | 2690 | 2850 | 804 | 258 | 255 | 193 | 188 | 151 | 110 | 768.75 |
| 1956 | 215 | 187 | 197 | 1220 | 2090 | 907 | 352 | 221 | 181 | 227 | 269 | 254 | 526.67 |
| 1957 | 150 | 123 | 238 | 1330 | 1430 | 583 | 547 | 278 | 179 | 190 | 982 | 1480 | 625.83 |
| 1958 | 625 | 295 | 417 | 2780 | 1920 | 634 | 671 | 1280 | 651 | 414 | 541 | 368 | 883 |
| 1959 | 211 | 153 | 141 | 1840 | 1720 | 743 | 365 | 385 | 447 | 594 | 1230 | 1030 | 738.25 |
| 1960 | 292 | 257 | 206 | 1830 | 3330 | 531 | 282 | 134 | 121 | 170 | 392 | 364 | 659.08 |
| 1961 | 193 | 119 | 126 | 791 | 4540 | 1290 | 326 | 239 | 683 | 647 | 438 | 525 | 826.42 |
| 1962 | 283 | 152 | 162 | 1430 | 1550 | 656 | 694 | 605 | 389 | 334 | 1440 | 504 | 683.25 |
| 1963 | 265 | 168 | 156 | 1360 | 3380 | 550 | 371 | 668 | 900 | 792 | 1960 | 789 | 946.58 |
| 1964 | 249 | 171 | 195 | 1450 | 1670 | 599 | 398 | 275 | 220 | 263 | 350 | 508 | 529 |
| 1965 | 470 | 234 | 277 | 750 | 1260 | 513 | 162 | 189 | 328 | 570 | 538 | 300 | 465.92 |
| 1966 | 238 | 230 | 513 | 1830 | 1770 | 479 | 196 | 133 | 125 | 413 | 883 | 609 | 618.25 |
| 1967 | 256 | 182 | 154 | 590 | 2600 | 710 | 320 | 270 | 860 | -9999 | -9999 | -9999 | -9999 |
| |
|
|
|
|
|
|
|
|
|
|
|
|
|
| Avg | 308.18 | 222.99 | 332.44 | 1802.98 | 2364.94 | 809.71 | 458.37 | 333.59 | 328.2 | 473.49 | 762.35 | 535.43 | 729.12 |
| |
|
|
|
|
|
|
|
|
|
|
|
|
|
| Std Dev | 139.37 |
110.73 |
334.99 |
778.3 |
856.01 |
321.82 |
220.52 |
236.34 |
230.75 |
283.74 |
480.74 |
362.72 |
127.11 |
| |
|
|
|
|
|
|
|
|
|
|
|
|
|
| | Jan | Feb | Mar | Apr | May | Jun | Jul | Aug | Sep | Oct | Nov | Dec | Avg Annual |
Click here for this table in tab-delimited format.
Tab-delimited format will open in most table browsing software, i.e. Excel, etc.
View this station on the map.
Return to start.