Results
| Country: | Cameroon
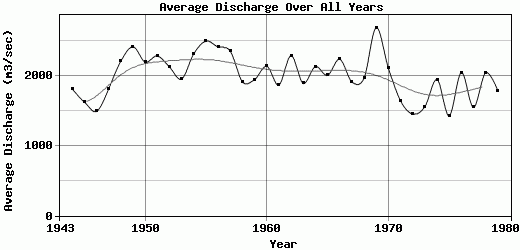
| | Station: | Edea | | River: | Sanaga | | Area: | 131520 km2 | | Lat: | 3.76 | | Lon: | 10.06 | | Source: | RivDIS | | PointID: | 27 | | Area Units: | km2 | | Discharge Units: | m3/sec | | Starting Year: | 1943 | | Ending Year: | 1980 | | Total Years: | 38 | | Total Usable Years: | 36 | |
| |
| Year | Jan | Feb | Mar | Apr | May | Jun | Jul | Aug | Sep | Oct | Nov | Dec | Avg Annual |
|---|
| 1943 | -9999 | -9999 | -9999 | -9999 | -9999 | -9999 | -9999 | -9999 | 3550 | 5150 | 4000 | 1360 | -9999 |
| 1944 | 720 | 413 | 484 | 703 | 1060 | 1010 | 1190 | 2560 | 3890 | 5320 | 3090 | 1280 | 1810 |
| 1945 | 873 | 421 | 250 | 234 | 565 | 1000 | 1480 | 1740 | 3860 | 5030 | 2840 | 1160 | 1621.08 |
| 1946 | 632 | 502 | 368 | 335 | 491 | 719 | 1340 | 1540 | 3210 | 4520 | 3000 | 1180 | 1486.42 |
| 1947 | 750 | 557 | 417 | 527 | 690 | 1470 | 1500 | 2730 | 4050 | 4630 | 3110 | 1230 | 1805.08 |
| 1948 | 1040 | 810 | 715 | 643 | 688 | 1180 | 2280 | 3530 | 5270 | 5780 | 3100 | 1370 | 2200.5 |
| 1949 | 870 | 628 | 408 | 621 | 594 | 1130 | 2250 | 3470 | 5600 | 6950 | 4580 | 1800 | 2408.42 |
| 1950 | 1120 | 806 | 529 | 670 | 1320 | 1510 | 2060 | 2510 | 5300 | 5970 | 3150 | 1350 | 2191.25 |
| 1951 | 866 | 554 | 542 | 517 | 661 | 1410 | 2150 | 3050 | 5070 | 6340 | 4520 | 1640 | 2276.67 |
| 1952 | 990 | 867 | 493 | 611 | 1190 | 1460 | 1890 | 2900 | 4520 | 5540 | 3510 | 1480 | 2120.92 |
| 1953 | 834 | 606 | 707 | 526 | 745 | 1090 | 1680 | 1800 | 4240 | 5630 | 3240 | 2290 | 1949 |
| 1954 | 819 | 636 | 563 | 828 | 950 | 1940 | 2560 | 2280 | 4960 | 6550 | 3990 | 1620 | 2308 |
| 1955 | 986 | 665 | 687 | 806 | 1250 | 1760 | 2810 | 3610 | 4720 | 6440 | 4410 | 1730 | 2489.5 |
| 1956 | 1040 | 673 | 1080 | 1470 | 1200 | 2250 | 2670 | 2740 | 4440 | 5850 | 3650 | 1820 | 2406.92 |
| 1957 | 1020 | 613 | 405 | 712 | 1090 | 2000 | 2630 | 3030 | 4450 | 6020 | 4230 | 1960 | 2346.67 |
| 1958 | 1070 | 696 | 505 | 781 | 1350 | 1570 | 1850 | 2260 | 3570 | 4420 | 3350 | 1500 | 1910.17 |
| 1959 | 864 | 486 | 296 | 513 | 937 | 1150 | 1880 | 2590 | 4030 | 5710 | 3470 | 1360 | 1940.5 |
| 1960 | 749 | 400 | 293 | 589 | 991 | 1080 | 1980 | 3110 | 4610 | 6190 | 3980 | 1590 | 2130.17 |
| 1961 | 1010 | 582 | 241 | 487 | 693 | 923 | 2180 | 1990 | 4090 | 6240 | 2800 | 1130 | 1863.83 |
| 1962 | 584 | 333 | 443 | 758 | 1180 | 1310 | 2180 | 2700 | 5100 | 6310 | 4290 | 2210 | 2283.17 |
| 1963 | 1100 | 755 | 612 | 679 | 1260 | 901 | 1550 | 2480 | 4070 | 5260 | 2820 | 1160 | 1887.25 |
| 1964 | 728 | 417 | 334 | 778 | 1020 | 1320 | 2140 | 2130 | 4520 | 6640 | 3900 | 1580 | 2125.58 |
| 1965 | 958 | 601 | 540 | 496 | 1110 | 1260 | 2190 | 3610 | 4270 | 5200 | 2640 | 1150 | 2002.08 |
| 1966 | 687 | 378 | 241 | 548 | 1530 | 2440 | 2570 | 3430 | 4630 | 5080 | 3780 | 1460 | 2231.17 |
| 1967 | 809 | 518 | 304 | 314 | 467 | 859 | 1590 | 3060 | 4380 | 6220 | 3100 | 1280 | 1908.42 |
| 1968 | 772 | 407 | 398 | 375 | 811 | 1260 | 1950 | 3170 | 4470 | 5070 | 3490 | 1360 | 1961.08 |
| 1969 | 787 | 492 | 853 | 804 | 1160 | 1560 | 3110 | 4640 | 6280 | 6170 | 4510 | 1780 | 2678.83 |
| 1970 | 988 | 542 | 470 | 895 | 1115 | 1431 | 2024 | 3146 | 4539 | 5449 | 3479 | 1203 | 2106.75 |
| 1971 | 808 | 678 | 754 | 775 | 694 | 764 | 1737 | 2249 | 4277 | 4389 | 1649 | 901 | 1639.58 |
| 1972 | 582 | 482 | 563 | 582 | 666 | 1322 | 1202 | 1590 | 2934 | 4568 | 2131 | 772 | 1449.5 |
| 1973 | 576 | 506 | 491 | 514 | 911 | 1304 | 1396 | 2428 | 3460 | 3794 | 2280 | 985 | 1553.75 |
| 1974 | 549 | 475 | 491 | 590 | 780 | 1320 | 1454 | 2717 | 4643 | 5828 | 3262 | 1191 | 1941.67 |
| 1975 | 808 | 795 | 766 | 736 | 672 | 932 | 1375 | 1879 | 3319 | 1564 | 2910 | 1343 | 1424.92 |
| 1976 | 778 | 774 | 765 | 854 | 1017 | 1210 | 1458 | 2771 | 4146 | 5473 | 3820 | 1414 | 2040 |
| 1977 | 878 | 749 | 681 | 661 | 629 | 775 | 1418 | 2277 | 4363 | 3970 | 1363 | 767 | 1544.25 |
| 1978 | 629 | 591 | 534 | 621 | 1084 | 1153 | 2165 | 2563 | 5114 | 5188 | 3613 | 1197 | 2037.67 |
| 1979 | 777 | 699 | 712 | 743 | 982 | 1303 | 1958 | 2807 | 3698 | 3750 | 2876 | 1085 | 1782.5 |
| 1980 | 680 | 600 | 638 | -9999 | -9999 | -9999 | -9999 | -9999 | -9999 | -9999 | -9999 | -9999 | -9999 |
| |
|
|
|
|
|
|
|
|
|
|
|
|
|
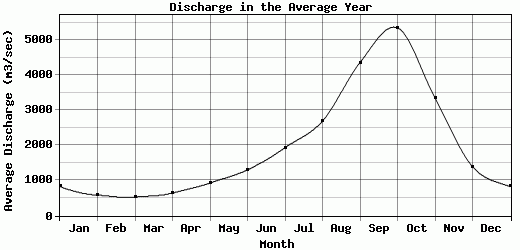
| Avg | 830.57 | 586.68 | 529 | 647.11 | 932.03 | 1307.67 | 1940.19 | 2696.86 | 4368.73 | 5356.84 | 3349.54 | 1396.97 | 1996.2 |
| |
|
|
|
|
|
|
|
|
|
|
|
|
|
| Std Dev | 156.53 |
136.38 |
186.43 |
208.2 |
266.8 |
390.08 |
474.04 |
645.84 |
682.69 |
1021.7 |
750.72 |
343.01 |
305.24 |
| |
|
|
|
|
|
|
|
|
|
|
|
|
|
| | Jan | Feb | Mar | Apr | May | Jun | Jul | Aug | Sep | Oct | Nov | Dec | Avg Annual |
Click here for this table in tab-delimited format.
Tab-delimited format will open in most table browsing software, i.e. Excel, etc.
View this station on the map.
Return to start.