Results
| Country: | Congo
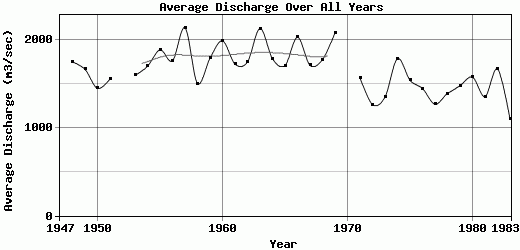
| | Station: | Ouesso | | River: | Sangha | | Area: | 158350 km2 | | Lat: | 1.61 | | Lon: | 16.05 | | Source: | RivDIS | | PointID: | 948 | | Area Units: | km2 | | Discharge Units: | m3/sec | | Starting Year: | 1947 | | Ending Year: | 1983 | | Total Years: | 37 | | Total Usable Years: | 35 | |
| |
| Year | Jan | Feb | Mar | Apr | May | Jun | Jul | Aug | Sep | Oct | Nov | Dec | Avg Annual |
|---|
| 1947 | -9999 | -9999 | -9999 | -9999 | -9999 | -9999 | -9999 | -9999 | -9999 | -9999 | -9999 | 1410 | -9999 |
| 1948 | 861 | 622 | 810 | 1020 | 1070 | 1880 | 1820 | 1570 | 2550 | 3170 | 3650 | 2000 | 1751.92 |
| 1949 | 1210 | 782 | 792 | 851 | 816 | 1310 | 1460 | 1590 | 2340 | 3610 | 3420 | 1830 | 1667.58 |
| 1950 | 1060 | 848 | 720 | 798 | 1110 | 1100 | 953 | 837 | 1540 | 3510 | 3350 | 1580 | 1450.5 |
| 1951 | 1070 | 753 | 940 | 1100 | 805 | 1390 | 1210 | 1050 | 1870 | 2940 | 3360 | 2210 | 1558.17 |
| 1952 | 1190 | 1060 | 706 | -9999 | -9999 | -9999 | 1800 | -9999 | -9999 | 2950 | 3190 | 2180 | -9999 |
| 1953 | 1240 | 984 | 1190 | 1040 | 1080 | 1310 | 1390 | 1140 | 1910 | 2860 | 3220 | 1840 | 1600.33 |
| 1954 | 1120 | 1190 | 1260 | 1190 | 1520 | 1770 | 1470 | 1010 | 1860 | 3190 | 2890 | 1950 | 1701.67 |
| 1955 | 1160 | 1040 | 1080 | 1320 | 1250 | 1530 | 1730 | 1780 | 2590 | 3680 | 3520 | 1990 | 1889.17 |
| 1956 | 1340 | 1030 | 1490 | 1470 | 1500 | 1850 | 1620 | 1100 | 1640 | 2830 | 3060 | 2240 | 1764.17 |
| 1957 | 1320 | 944 | 927 | 1130 | 1350 | 1840 | 1940 | 1850 | 3080 | 4140 | 4280 | 2890 | 2140.92 |
| 1958 | 1670 | 1190 | 1100 | 1280 | 1770 | 1720 | 1120 | 1080 | 1340 | 2030 | 2160 | 1620 | 1506.67 |
| 1959 | 1040 | 793 | 656 | 967 | 1530 | 1440 | 1500 | 1670 | 2170 | 3410 | 4080 | 2280 | 1794.67 |
| 1960 | 1330 | 1010 | 1050 | 1230 | 1460 | 1330 | 1390 | 1730 | 2630 | 4120 | 4290 | 2340 | 1992.5 |
| 1961 | 1600 | 1150 | 869 | 1000 | 1080 | 1210 | 1770 | 1370 | 2120 | 3520 | 3290 | 1760 | 1728.25 |
| 1962 | 919 | 729 | 870 | 1200 | 1340 | 1300 | 1380 | 1180 | 2010 | 3560 | 3960 | 2570 | 1751.5 |
| 1963 | 1470 | 1270 | 1440 | 1710 | 2200 | 1900 | 2160 | 1980 | 2810 | 3790 | 3000 | 1870 | 2133.33 |
| 1964 | 1500 | 1080 | 976 | 1300 | 1420 | 1700 | 1430 | 927 | 1940 | 3430 | 3770 | 1990 | 1788.58 |
| 1965 | 1400 | 1070 | 1090 | 1180 | 1220 | 1140 | 1470 | 1820 | 2300 | 3180 | 3020 | 1640 | 1710.83 |
| 1966 | 1190 | 862 | 794 | 1010 | 1620 | 2070 | 1910 | 1850 | 2850 | 3330 | 4070 | 2840 | 2033 |
| 1967 | 1510 | 1070 | 854 | 745 | 869 | 1300 | 1690 | 1630 | 2240 | 3710 | 3190 | 1760 | 1714 |
| 1968 | 1220 | 840 | 842 | 928 | 1580 | 1800 | 1780 | 1670 | 2330 | 3050 | 3180 | 2130 | 1779.17 |
| 1969 | 1278 | 995 | 1592 | 1489 | 1588 | 1597 | 1965 | 2548 | 2889 | 3307 | 3544 | 2199 | 2082.58 |
| 1970 | 1312 | 973 | 950 | 994 | 1151 | 1450 | 1446 | 2088 | -9999 | 3615 | 3826 | 1850 | -9999 |
| 1971 | 1280 | 809 | 839 | 1040 | 912 | 1020 | 1190 | 1530 | 2190 | 3090 | 3150 | 1800 | 1570.83 |
| 1972 | 947 | 714 | 713 | 919 | 894 | 1130 | 935 | 1200 | 1540 | 2610 | 2450 | 1150 | 1266.83 |
| 1973 | 993 | 678 | 602 | 797 | 1050 | 1440 | 1170 | 1200 | 2080 | 2520 | 2360 | 1340 | 1352.5 |
| 1974 | 813 | 633 | 677 | 828 | 1200 | 1340 | 1250 | 1760 | 2550 | 3970 | 4100 | 2340 | 1788.42 |
| 1975 | 1210 | 1110 | 925 | 1070 | 1170 | 1270 | 1530 | 1000 | 1330 | 3000 | 3050 | 1860 | 1543.75 |
| 1976 | 961 | 882 | 961 | 1060 | 1130 | 1510 | 1210 | 1250 | 1580 | 2550 | 2760 | 1530 | 1448.67 |
| 1977 | 1100 | 786 | 562 | 664 | 751 | 1120 | 918 | 903 | 2340 | 2900 | 1900 | 1310 | 1271.17 |
| 1978 | 685 | 509 | 548 | 865 | 1450 | 1350 | 1050 | 951 | 1860 | 3100 | 3000 | 1340 | 1392.33 |
| 1979 | 888 | 634 | 594 | 721 | 1300 | 1960 | 1570 | 1600 | 2210 | 2560 | 2430 | 1320 | 1482.25 |
| 1980 | 954 | 589 | 524 | 652 | 1050 | 1510 | 1070 | 1510 | 2420 | 3480 | 3430 | 1750 | 1578.25 |
| 1981 | 1010 | 686 | 667 | 635 | 1240 | 1230 | 994 | 1270 | 2190 | 2480 | 2540 | 1350 | 1357.67 |
| 1982 | 1043 | 673 | 674 | 810 | 1440 | 1441 | 1708 | 1777 | 2617 | 3239 | 3136 | 1505 | 1671.92 |
| 1983 | 861 | 544 | 380 | 556 | 830 | 927 | 769 | 798 | 1169 | 2282 | 2648 | 1407 | 1097.58 |
| |
|
|
|
|
|
|
|
|
|
|
|
|
|
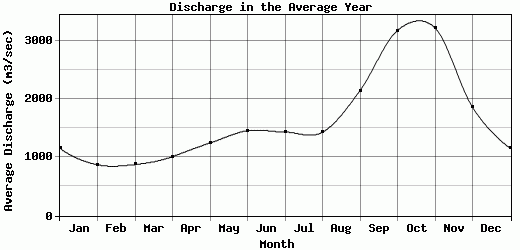
| Avg | 1159.86 | 875.89 | 879.56 | 1016.26 | 1249.89 | 1462.43 | 1438 | 1434.83 | 2149.56 | 3186.47 | 3229.83 | 1864.08 | 1657.7 |
| |
|
|
|
|
|
|
|
|
|
|
|
|
|
| Std Dev | 228.93 |
201.45 |
271.68 |
258.26 |
308.84 |
287.12 |
338.96 |
404.95 |
469.91 |
498.88 |
586.03 |
420.55 |
248.91 |
| |
|
|
|
|
|
|
|
|
|
|
|
|
|
| | Jan | Feb | Mar | Apr | May | Jun | Jul | Aug | Sep | Oct | Nov | Dec | Avg Annual |
Click here for this table in tab-delimited format.
Tab-delimited format will open in most table browsing software, i.e. Excel, etc.
View this station on the map.
Return to start.