Results
| Country: | Central_African_Rep.
| | Station: | Salo | | River: | Sangha | | Area: | 68300 km2 | | Lat: | 3.18 | | Lon: | 16.12 | | Source: | RivDIS | | PointID: | 14 | | Area Units: | km2 | | Discharge Units: | m3/sec | | Starting Year: | 1969 | | Ending Year: | 1988 | | Total Years: | 20 | | Total Usable Years: | 19 | |
| |
| Year | Jan | Feb | Mar | Apr | May | Jun | Jul | Aug | Sep | Oct | Nov | Dec | Avg Annual |
|---|
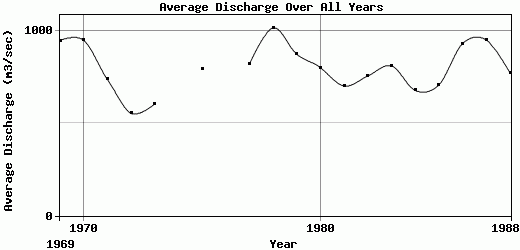
| 1969 | 512 | 396 | 630 | 513 | 579 | 619 | 1050 | 1490 | 1630 | 1860 | 1330 | 760 | 947.42 |
| 1970 | 570 | 414 | 362 | 411 | 461 | 574 | 788 | 1310 | 1730 | 2280 | 1710 | 775 | 948.75 |
| 1971 | 589 | 404 | 405 | 449 | 394 | 464 | 545 | 802 | 1216 | 1806 | 1073 | 706 | 737.75 |
| 1972 | 456 | 339 | 340 | 408 | 353 | 528 | 484 | 608 | 818 | 1058 | 800 | 448 | 553.33 |
| 1973 | 413 | 286 | 218 | 321 | 431 | 524 | 609 | 740 | 1020 | 1110 | 975 | 599 | 603.83 |
| 1974 | 385 | 280 | 266 | 321 | 431 | 585 | 560 | 1010 | 1630 | 2450 | 1920 | -9999 | -9999 |
| 1975 | 555 | 496 | 434 | 403 | 467 | 623 | 802 | 627 | 757 | 2070 | 1460 | 853 | 795.58 |
| 1976 | -9999 | -9999 | -9999 | 518 | 554 | 604 | 695 | 661 | 950 | 1700 | 1160 | 725 | -9999 |
| 1977 | 596 | 594 | 568 | 539 | 590 | 728 | 709 | 622 | 952 | 1850 | 1290 | 790 | 819 |
| 1978 | 620 | 565 | 541 | 575 | 590 | 699 | 844 | 982 | 1860 | 2300 | 1730 | 879 | 1015.42 |
| 1979 | 713 | 620 | 731 | 673 | 635 | 823 | 824 | 729 | 1010 | 1690 | 1200 | 825 | 872.75 |
| 1980 | 567 | 437 | 384 | 438 | 512 | 743 | 857 | 847 | 152 | 1880 | 1810 | 976 | 800.25 |
| 1981 | 637 | 464 | 326 | 444 | 428 | 498 | 714 | 555 | 1120 | 1760 | 923 | 548 | 701.42 |
| 1982 | 391 | 311 | 343 | 408 | 441 | 517 | 591 | 616 | 1050 | 1920 | 1580 | 893 | 755.08 |
| 1983 | 595 | 519 | 507 | 570 | 630 | 591 | 736 | 843 | 1260 | 1710 | 1070 | 679 | 809.17 |
| 1984 | 610 | 418 | 350 | 486 | 457 | 527 | 540 | 384 | 945 | 1620 | 1160 | 627 | 677 |
| 1985 | 509 | 390 | 380 | 390 | 426 | 464 | 723 | 860 | 1200 | 1520 | 1020 | 597 | 706.58 |
| 1986 | 450 | 323 | 284 | 352 | 508 | 691 | 828 | 980 | 1940 | 1970 | 1910 | 922 | 929.83 |
| 1987 | 626 | 477 | 364 | 907 | 359 | 592 | 785 | 938 | 1700 | 2410 | 1440 | 804 | 950.17 |
| 1988 | 607 | 425 | 439 | 467 | 584 | 695 | 820 | 938 | 1060 | 1410 | 1100 | 726 | 772.58 |
| |
|
|
|
|
|
|
|
|
|
|
|
|
|
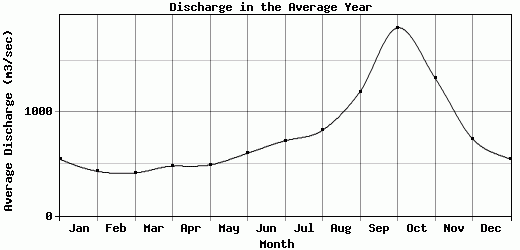
| Avg | 547.42 | 429.37 | 414.32 | 479.65 | 491.5 | 604.45 | 725.2 | 827.1 | 1200 | 1818.7 | 1333.05 | 743.79 | 799.77 |
| |
|
|
|
|
|
|
|
|
|
|
|
|
|
| Std Dev | 89.19 |
96.76 |
126.4 |
130.97 |
85.78 |
96.38 |
135.07 |
252.02 |
426.28 |
368.65 |
334.82 |
133.77 |
123.6 |
| |
|
|
|
|
|
|
|
|
|
|
|
|
|
| | Jan | Feb | Mar | Apr | May | Jun | Jul | Aug | Sep | Oct | Nov | Dec | Avg Annual |
Click here for this table in tab-delimited format.
Tab-delimited format will open in most table browsing software, i.e. Excel, etc.
View this station on the map.
Return to start.