Results
| Country: | Mali
| | Station: | Gouala | | River: | Sankarani | | Area: | 35300 km2 | | Lat: | 11.97 | | Lon: | -8.23 | | Source: | RivDIS | | PointID: | 1506 | | Area Units: | km2 | | Discharge Units: | m3/sec | | Starting Year: | 1954 | | Ending Year: | 1979 | | Total Years: | 26 | | Total Usable Years: | 17 | |
| |
| Year | Jan | Feb | Mar | Apr | May | Jun | Jul | Aug | Sep | Oct | Nov | Dec | Avg Annual |
|---|
| 1954 | -9999 | -9999 | -9999 | 44 | 52.7 | 139 | 339 | -9999 | -9999 | 1130 | 891 | 328 | -9999 |
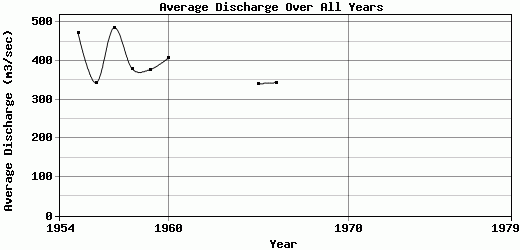
| 1955 | 171 | 89.6 | 79.1 | 56.6 | 63.5 | 202 | 460 | 1089 | 1448 | 1230 | 527 | 254 | 472.48 |
| 1956 | 136 | 77.7 | 56.8 | 44.8 | 37.8 | 66.3 | 234 | 699 | 1260 | 980 | 361 | 160 | 342.78 |
| 1957 | 81.4 | 41.8 | 26.4 | 16.4 | 32.6 | 111 | 33 | 1097 | 1667 | 1660 | 775 | 282 | 485.3 |
| 1958 | 150 | 93.2 | 45 | 42.6 | 66.3 | 200 | 408 | 671 | 1178 | 940 | 460 | 305 | 379.93 |
| 1959 | 141 | 77.6 | 49 | 27.5 | 37 | 71.5 | 333 | 737 | 1460 | 1046 | 388 | 160 | 377.3 |
| 1960 | 79.1 | 39.6 | 21.5 | 30 | 37.7 | 88 | 381 | 1015 | 1480 | 1080 | 460 | 165 | 406.41 |
| 1961 | -9999 | -9999 | 22.4 | 16.4 | -9999 | -9999 | -9999 | -9999 | -9999 | -9999 | -9999 | -9999 | -9999 |
| 1962 | -9999 | -9999 | -9999 | -9999 | -9999 | -9999 | 513 | 843 | 1720 | 1393 | 638 | 267 | -9999 |
| 1963 | 141 | 808 | -9999 | -9999 | -9999 | 50.8 | 154 | 619 | 1374 | 1529 | 631 | 210 | -9999 |
| 1964 | 106 | -9999 | 28 | -9999 | -9999 | 90.3 | 242 | 1057 | 1345 | 115 | -9999 | -9999 | -9999 |
| 1965 | 134 | 73.7 | 33.8 | 19.6 | 22.8 | 98.1 | 520 | 672 | 1119 | 892 | 367 | 136 | 340.67 |
| 1966 | 69.6 | 35.1 | 19.2 | 21.8 | 19.7 | 45.6 | 105 | 728 | 1199 | 1207 | 501 | 176 | 343.92 |
| 1967 | 82.3 | 47.8 | 27.1 | 16.4 | -9999 | -9999 | 237 | 647 | 1441 | 1736 | 614 | 216 | -9999 |
| 1968 | 111 | -9999 | -9999 | -9999 | -9999 | -9999 | 262 | 908 | 1196 | 990 | 448 | 193 | -9999 |
| 1969 | 92.1 | -9999 | -9999 | -9999 | -9999 | 65.3 | 491 | 1134 | 1774 | 1308 | 748 | 255 | -9999 |
| 1970 | 117 | 67.2 | 42.9 | 36.6 | 28 | -9999 | 120 | 618 | 1386 | 639 | 296 | 120 | -9999 |
| 1971 | -9999 | -9999 | -9999 | -9999 | -9999 | -9999 | 150 | 469 | 1029 | -9999 | 258 | 122 | -9999 |
| 1972 | -9999 | -9999 | -9999 | -9999 | -9999 | -9999 | -9999 | -9999 | -9999 | -9999 | 243 | 122 | -9999 |
| 1973 | -9999 | -9999 | -9999 | -9999 | -9999 | -9999 | -9999 | -9999 | -9999 | -9999 | -9999 | -9999 | -9999 |
| 1974 | -9999 | -9999 | -9999 | -9999 | -9999 | -9999 | -9999 | -9999 | -9999 | -9999 | -9999 | -9999 | -9999 |
| 1975 | -9999 | -9999 | -9999 | -9999 | 45.7 | 69.3 | 320 | 997 | 1502 | 1466 | 503 | 126 | -9999 |
| 1976 | 52.6 | -9999 | 21.9 | 22.1 | 53.1 | 73.8 | 178 | 624 | 830 | 1138 | 935 | 277 | -9999 |
| 1977 | -9999 | -9999 | -9999 | 17.2 | 23.8 | 61 | 160 | 516 | 938 | 711 | 253 | 91.8 | -9999 |
| 1978 | -9999 | -9999 | -9999 | -9999 | -9999 | -9999 | -9999 | -9999 | -9999 | -9999 | -9999 | -9999 | -9999 |
| 1979 | -9999 | -9999 | 25.8 | 23.7 | -9999 | -9999 | -9999 | -9999 | -9999 | -9999 | -9999 | -9999 | -9999 |
| |
|
|
|
|
|
|
|
|
|
|
|
|
|
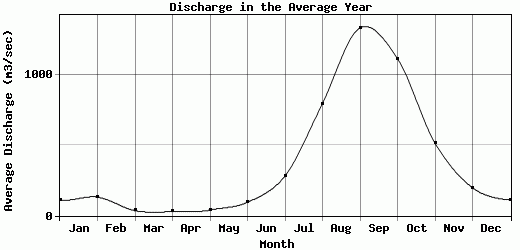
| Avg | 110.94 | 131.94 | 35.64 | 29.05 | 40.05 | 95.47 | 282 | 796.84 | 1334 | 1115.26 | 514.85 | 198.29 | 393.6 |
| |
|
|
|
|
|
|
|
|
|
|
|
|
|
| Std Dev | 33 |
214.67 |
16.49 |
12.42 |
14.67 |
47.37 |
142.08 |
206.55 |
247.61 |
371.64 |
200.93 |
69.17 |
53.74 |
| |
|
|
|
|
|
|
|
|
|
|
|
|
|
| | Jan | Feb | Mar | Apr | May | Jun | Jul | Aug | Sep | Oct | Nov | Dec | Avg Annual |
Click here for this table in tab-delimited format.
Tab-delimited format will open in most table browsing software, i.e. Excel, etc.
View this station on the map.
Return to start.