Results
| Country: | U.S.A.
| | Station: | Vernalis,California | | River: | SanJoaquin | | Area: | 35058 km2 | | Lat: | 37.68 | | Lon: | -121.26 | | Source: | RivDIS | | PointID: | 352 | | Area Units: | km2 | | Discharge Units: | m3/sec | | Starting Year: | 1965 | | Ending Year: | 1984 | | Total Years: | 20 | | Total Usable Years: | 20 | |
| |
| Year | Jan | Feb | Mar | Apr | May | Jun | Jul | Aug | Sep | Oct | Nov | Dec | Avg Annual |
|---|
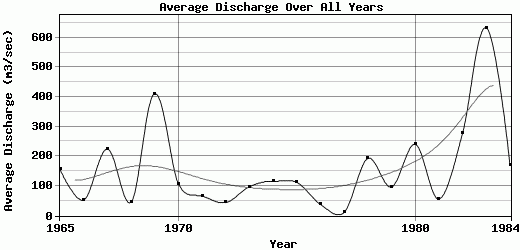
| 1965 | 407 | 224 | 151 | 279 | 150 | 160 | 56 | 35 | 48 | 83 | 103 | 176 | 156 |
| 1966 | 149 | 116 | 54 | 28 | 24 | 16 | 13 | 14 | 20 | 31 | 38 | 124 | 52.25 |
| 1967 | 91 | 180 | 181 | 410 | 576 | 566 | 296 | 57 | 58 | 77 | 98 | 103 | 224.42 |
| 1968 | 82.5 | 73 | 87 | 40 | 25 | 16.5 | 14 | 21.5 | 26 | 39 | 45 | 71 | 45.04 |
| 1969 | 386 | 911 | 864 | 619 | 689 | 780 | 162 | 65 | 91 | 124 | 130 | 112 | 411.08 |
| 1970 | 311 | 257 | 201 | 47 | 67 | 75.5 | 37 | 29 | 37 | 41 | 46.5 | 141 | 107.5 |
| 1971 | 145 | 122 | 72.5 | 55 | 51.5 | 85.5 | 30 | 25 | 31 | 63 | 46 | 67 | 66.13 |
| 1972 | 87 | 76 | 39 | 29 | 21 | 16.5 | 13.5 | 15 | 44 | 56 | 62 | 70 | 44.08 |
| 1973 | 115 | 226 | 216 | 119 | 83 | 73 | 30.5 | 30 | 41.5 | 72 | 64.5 | 102 | 97.71 |
| 1974 | 220 | 144 | 136 | 166 | 116 | 109 | 46.5 | 45.5 | 80.5 | 99 | 110 | 118 | 115.88 |
| 1975 | 107 | 176 | 161 | 112 | 112 | 162 | 48.5 | 47.5 | 75 | 129 | 111 | 106 | 112.25 |
| 1976 | 90 | 60 | 50 | 36 | 26 | 22 | 19 | 30 | 30 | 36 | 32 | 27 | 38.17 |
| 1977 | 31 | 22 | 15 | 6 | 11 | 3.3 | 2.6 | 3.5 | 5 | 6.9 | 12 | 14 | 11.03 |
| 1978 | 65 | 205 | 321 | 561 | 535 | 198 | 55 | 40 | 75 | 90 | 95 | 75 | 192.92 |
| 1979 | 146 | 200 | 242 | 100 | 70 | 60 | 37 | 41 | 50 | 75 | 65 | 70 | 96.33 |
| 1980 | 370 | 532 | 716 | 290 | 280 | 150 | 96 | 53.5 | 108 | 115 | 93 | 83.5 | 240.58 |
| 1981 | 92 | 81.5 | 88.5 | 71.5 | 55.5 | 42.5 | 36 | 36 | 33.5 | 39 | 44.5 | 52.5 | 56.08 |
| 1982 | 110 | 188 | 285 | 650 | 520 | 215 | 174 | 114 | 173 | 232 | 197 | 467 | 277.08 |
| 1983 | 540 | 804 | 1133 | 1032 | 809 | 738 | 544 | 256 | 520 | 377 | 302 | 541 | 633 |
| 1984 | 725 | 306 | 212 | 121 | 91.5 | 65 | 54 | 61.5 | 82.5 | 108 | 80 | 135 | 170.13 |
| |
|
|
|
|
|
|
|
|
|
|
|
|
|
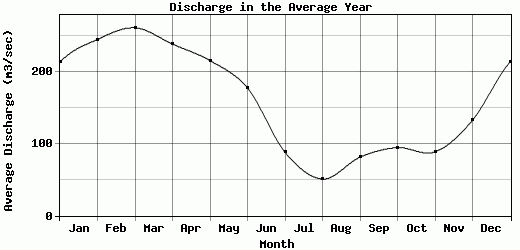
| Avg | 213.48 | 245.18 | 261.25 | 238.58 | 215.63 | 177.69 | 88.23 | 51 | 81.45 | 94.65 | 88.73 | 132.75 | 157.38 |
| |
|
|
|
|
|
|
|
|
|
|
|
|
|
| Std Dev | 180.03 |
231.27 |
289.87 |
271.19 |
249.74 |
228.35 |
125.29 |
52.4 |
107.1 |
80.43 |
63.76 |
129.83 |
145.26 |
| |
|
|
|
|
|
|
|
|
|
|
|
|
|
| | Jan | Feb | Mar | Apr | May | Jun | Jul | Aug | Sep | Oct | Nov | Dec | Avg Annual |
Click here for this table in tab-delimited format.
Tab-delimited format will open in most table browsing software, i.e. Excel, etc.
View this station on the map.
Return to start.