Results
| Country: | Brazil
| | Station: | Juazeiro | | River: | SaoFrancisco | | Area: | 510800 km2 | | Lat: | -9.41 | | Lon: | -40.5 | | Source: | RivDIS | | PointID: | 519 | | Area Units: | km2 | | Discharge Units: | m3/sec | | Starting Year: | 1929 | | Ending Year: | 1979 | | Total Years: | 51 | | Total Usable Years: | 50 | |
| |
| Year | Jan | Feb | Mar | Apr | May | Jun | Jul | Aug | Sep | Oct | Nov | Dec | Avg Annual |
|---|
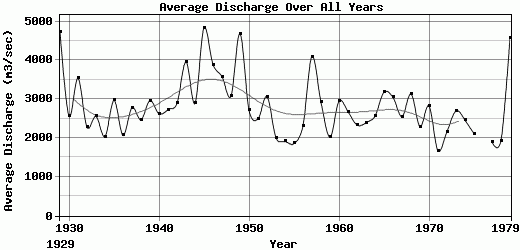
| 1929 | 5414 | 6066 | 7750 | 6552 | 3745 | 2546 | 2192 | 1890 | 1630 | 12930 | 1736 | 4195 | 4720.5 |
| 1930 | 3779 | 3728 | 3729 | 2895 | 2179 | 1664 | 1429 | 1242 | 1082 | 1012 | 2973 | 5026 | 2561.5 |
| 1931 | 4763 | 4892 | 6855 | 7682 | 4584 | 2499 | 1982 | 1785 | 1558 | 1482 | 2047 | 2314 | 3536.92 |
| 1932 | 4118 | 4612 | 3296 | 2086 | 1533 | 1395 | 1273 | 1078 | 976 | 1062 | 2205 | 3676 | 2275.83 |
| 1933 | 5102 | 5651 | 3500 | 2784 | 2013 | 1453 | 1339 | 1162 | 988 | 1298 | 1901 | 3467 | 2554.83 |
| 1934 | 6269 | 4350 | 2401 | 1726 | 1901 | 1264 | 1080 | 968 | 854 | 915 | 974 | 1714 | 2034.67 |
| 1935 | 4591 | 5547 | 5532 | 4779 | 3815 | 2120 | 1668 | 1295 | 1144 | 1168 | 1275 | 2672 | 2967.17 |
| 1936 | 2787 | 2756 | 4242 | 2854 | 2213 | 1377 | 1183 | 1009 | 925 | 956 | 1695 | 2814 | 2067.58 |
| 1937 | 4713 | 5710 | 4351 | 2976 | 2338 | 1560 | 1329 | 1129 | 969 | 989 | 2503 | 4774 | 2778.42 |
| 1938 | 6455 | 4330 | 3930 | 2466 | 1718 | 1527 | 1270 | 1146 | 1065 | 1022 | 1645 | 3041 | 2467.92 |
| 1939 | 5868 | 6807 | 7366 | 2470 | 1917 | 1535 | 1230 | 1150 | 1080 | 2234 | 1511 | 2382 | 2962.5 |
| 1940 | 3185 | 4280 | 5608 | 4404 | 2025 | 1524 | 1286 | 1079 | 926 | 999 | 2229 | 3903 | 2620.67 |
| 1941 | 5088 | 4516 | 4207 | 4872 | 2826 | 1771 | 1532 | 1364 | 1110 | 1232 | 1782 | 2414 | 2726.17 |
| 1942 | 4702 | 4508 | 5374 | 3431 | 2365 | 1656 | 1403 | 1210 | 1109 | 1363 | 2317 | 5267 | 2892.08 |
| 1943 | 6195 | 9503 | 7996 | 5116 | 2931 | 2169 | 1826 | 1569 | 1331 | 1440 | 2258 | 5167 | 3958.42 |
| 1944 | 6347 | 4881 | 4769 | 3764 | 2569 | 1790 | 1516 | 1319 | 1137 | 985 | 1701 | 3881 | 2888.25 |
| 1945 | 5640 | 6957 | 8009 | 7164 | 8804 | 3966 | 2641 | 2131 | 1754 | 2027 | 3305 | 5601 | 4833.25 |
| 1946 | 7303 | 10113 | 4612 | 5599 | 3614 | 2504 | 2062 | 1775 | 1544 | 1564 | 2215 | 3799 | 3892 |
| 1947 | 3780 | 5154 | 5713 | 7303 | 4348 | 2405 | 1994 | 1675 | 1662 | 1481 | 3151 | 4273 | 3578.25 |
| 1948 | 6350 | 4542 | 5430 | 4043 | 2262 | 1898 | 1629 | 1402 | 1245 | 1364 | 1545 | 5169 | 3073.25 |
| 1949 | 7877 | 9259 | 12501 | 7154 | 3534 | 2639 | 2208 | 1871 | 1595 | 1509 | 2973 | 2988 | 4675.67 |
| 1950 | 4472 | 4731 | 3496 | 3815 | 2667 | 1793 | 1562 | 1346 | 1107 | 1304 | 2186 | 4151 | 2719.17 |
| 1951 | 4203 | 4179 | 4459 | 4870 | 2570 | 1897 | 1532 | 1316 | 1135 | 1054 | 961 | 1680 | 2488 |
| 1952 | 3347 | 4733 | 5799 | 6952 | 3294 | 2022 | 1654 | 1352 | 1227 | 1170 | 1824 | 3428 | 3066.83 |
| 1953 | 3595 | 1842 | 2709 | 3753 | 1984 | 1348 | 1139 | 993 | 868 | 1192 | 1441 | 3227 | 2007.58 |
| 1954 | 4426 | 2823 | 2821 | 2476 | 1487 | 1236 | 1000 | 861 | 707 | 628 | 889 | 3576 | 1910.83 |
| 1955 | 2362 | 4074 | 2213 | 2658 | 1493 | 1100 | 913 | 789 | 664 | 644 | 2028 | 3342 | 1856.67 |
| 1956 | 5379 | 2263 | 4603 | 2588 | 1822 | 1687 | 1363 | 1094 | 919 | 849 | 1501 | 3717 | 2315.42 |
| 1957 | 5951 | 7132 | 6864 | 7999 | 5839 | 2812 | 2082 | 1690 | 1413 | 1565 | 1457 | 4363 | 4097.25 |
| 1958 | 3655 | 5222 | 3421 | 3143 | 8466 | 1744 | 1453 | 1461 | 1158 | 1561 | 1887 | 1842 | 2917.75 |
| 1959 | 3629 | 3691 | 3526 | 2747 | 1404 | 1170 | 1037 | 918 | 824 | 854 | 1646 | 2761 | 2017.25 |
| 1960 | 3328 | 5735 | 6131 | 6068 | 2473 | 1810 | 1427 | 1181 | 994 | 913 | 1102 | 4194 | 2946.33 |
| 1961 | 5335 | 6279 | 5604 | 3484 | 2450 | 1798 | 1396 | 1198 | 998 | 898 | 1048 | 1628 | 2676.33 |
| 1962 | 3224 | 4818 | 3678 | 2876 | 2104 | 1695 | 1577 | 1109 | 854 | 1142 | 1836 | 3129 | 2336.83 |
| 1963 | 6188 | 7041 | 3435 | 1740 | 1547 | 1333 | 1292 | 1238 | 1162 | 1087 | 1253 | 1390 | 2392.17 |
| 1964 | 3195 | 6402 | 4244 | 2285 | 1510 | 1243 | 1144 | 1123 | 1034 | 1244 | 3227 | 4071 | 2560.17 |
| 1965 | 4295 | 4445 | 5416 | 5641 | 2796 | 1964 | 1778 | 1593 | 1400 | 1756 | 2928 | 4131 | 3178.58 |
| 1966 | 3656 | 6076 | 6219 | 4215 | 2607 | 2049 | 1819 | 1749 | 1530 | 1786 | 2304 | 2517 | 3043.92 |
| 1967 | 4189 | 4162 | 3633 | 3336 | 2512 | 1733 | 1583 | 1486 | 1343 | 1311 | 1838 | 3430 | 2546.33 |
| 1968 | 5509 | 4106 | 5926 | 4920 | 2414 | 1899 | 1774 | 1687 | 1631 | 1632 | 2013 | 4082 | 3132.75 |
| 1969 | 2644 | 3552 | 3622 | 2380 | 1836 | 1495 | 1576 | 1532 | 1307 | 1303 | 2191 | 4041 | 2289.92 |
| 1970 | 4929 | 5773 | 4489 | 2532 | 1981 | 1601 | 1503 | 1458 | 1582 | 1988 | 3143 | 2908 | 2823.92 |
| 1971 | 2115 | 2000 | 2066 | 1497 | 1193 | 971 | 862 | 801 | 729 | 1022 | 1899 | 4860 | 1667.92 |
| 1972 | 3704 | 2318 | 3021 | 2841 | 1840 | 1399 | 1299 | 1204 | 1163 | 1525 | 1828 | 3799 | 2161.75 |
| 1973 | 4423 | 3463 | 3135 | 4342 | 2042 | 1486 | 1326 | 1245 | 1261 | 1640 | 3571 | 4409 | 2695.25 |
| 1974 | 4049 | 2893 | 2870 | 4699 | 2865 | 1938 | 1713 | 1492 | 1312 | 1391 | 2043 | 2226 | 2457.58 |
| 1975 | 3724 | 3769 | 2289 | 2465 | 2051 | 1440 | 1382 | 1211 | 1045 | 1375 | 2279 | 2322 | 2112.67 |
| 1976 | -9999 | -9999 | -9999 | -9999 | -9999 | -9999 | -9999 | -9999 | -9999 | -9999 | -9999 | -9999 | -9999 |
| 1977 | 3371 | 3227 | 1688 | 1712 | 1828 | 1419 | 1416 | 1456 | 1576 | 1828 | 1705 | 1521 | 1895.58 |
| 1978 | 1527 | 1505 | 1356 | 2170 | 2327 | 1755 | 1584 | 1618 | 1687 | 2052 | 2578 | 3033 | 1932.67 |
| 1979 | 4656 | 7709 | 12950 | 8840 | 2870 | 2473 | 2156 | 2129 | 2432 | 2393 | 3402 | 2798 | 4567.33 |
| |
|
|
|
|
|
|
|
|
|
|
|
|
|
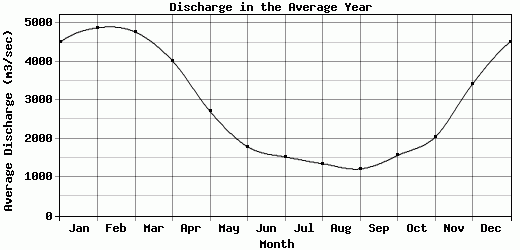
| Avg | 4508.12 | 4882.5 | 4777.08 | 4023.28 | 2710.12 | 1791.44 | 1528.28 | 1351.58 | 1214.92 | 1562.78 | 2038.98 | 3422.26 | 2817.61 |
| |
|
|
|
|
|
|
|
|
|
|
|
|
|
| Std Dev | 1332.87 |
1863.61 |
2297.6 |
1867.81 |
1494.77 |
521.44 |
361.22 |
316.37 |
329.57 |
1669.88 |
668.48 |
1063.06 |
773.83 |
| |
|
|
|
|
|
|
|
|
|
|
|
|
|
| | Jan | Feb | Mar | Apr | May | Jun | Jul | Aug | Sep | Oct | Nov | Dec | Avg Annual |
Click here for this table in tab-delimited format.
Tab-delimited format will open in most table browsing software, i.e. Excel, etc.
View this station on the map.
Return to start.