Results
| Country: | U.S.A.
| | Station: | Clyd,Georgia | | River: | Savannah | | Area: | 25511 km2 | | Lat: | 32.53 | | Lon: | -81.26 | | Source: | RivDIS | | PointID: | 405 | | Area Units: | km2 | | Discharge Units: | m3/sec | | Starting Year: | 1930 | | Ending Year: | 1984 | | Total Years: | 55 | | Total Usable Years: | 51 | |
| |
| Year | Jan | Feb | Mar | Apr | May | Jun | Jul | Aug | Sep | Oct | Nov | Dec | Avg Annual |
|---|
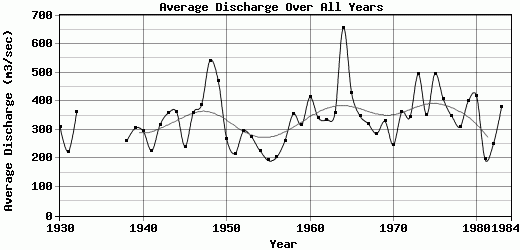
| 1930 | 526 | 577 | 475 | 400 | 265 | 228 | 199 | 167 | 184 | 143 | 268 | 308 | 311.67 |
| 1931 | 376 | 258 | 294 | 355 | 328 | 150 | 149 | 164 | 87 | 78 | 91 | 349 | 223.25 |
| 1932 | 689 | 491 | 506 | 334 | 241 | 296 | 179 | 272 | 125 | 297 | 346 | 553 | 360.75 |
| 1933 | 774 | 648 | 463 | 314 | 271 | 173 | 190 | 150 | 197 | -9999 | -9999 | -9999 | -9999 |
| 1934 | -9999 | -9999 | -9999 | -9999 | -9999 | -9999 | -9999 | -9999 | -9999 | -9999 | -9999 | -9999 | -9999 |
| 1935 | -9999 | -9999 | -9999 | -9999 | -9999 | -9999 | -9999 | -9999 | -9999 | -9999 | -9999 | -9999 | -9999 |
| 1936 | -9999 | -9999 | -9999 | -9999 | -9999 | -9999 | -9999 | -9999 | -9999 | -9999 | -9999 | -9999 | -9999 |
| 1937 | -9999 | -9999 | -9999 | -9999 | -9999 | -9999 | -9999 | -9999 | -9999 | 297 | 306 | 247 | -9999 |
| 1938 | 261 | 197 | 262 | 650 | 216 | 274 | 221 | 449 | 146 | 120 | 156 | 168 | 260 |
| 1939 | 235 | 582 | 879 | 385 | 268 | 212 | 184 | 295 | 206 | 144 | 122 | 145 | 304.75 |
| 1940 | 238 | 377 | 363 | 292 | 168 | 160 | 161 | 930 | 282 | 121 | 203 | 251 | 295.5 |
| 1941 | 302 | 203 | 278 | 318 | 137 | 140 | 602 | 210 | 116 | 97 | 108 | 214 | 227.08 |
| 1942 | 421 | 387 | 826 | 487 | 265 | 256 | 207 | 222 | 183 | 153 | 158 | 239 | 317 |
| 1943 | 739 | 672 | 559 | 464 | 358 | 230 | 412 | 232 | 176 | 132 | 161 | 173 | 359 |
| 1944 | 396 | 512 | 984 | 871 | 413 | 210 | 174 | 156 | 147 | 146 | 137 | 193 | 361.58 |
| 1945 | 215 | 302 | 386 | 279 | 353 | 155 | 153 | 205 | 264 | 154 | 146 | 287 | 241.58 |
| 1946 | 969 | 554 | 490 | 508 | 404 | 261 | 189 | 184 | 141 | 235 | 208 | 176 | 359.92 |
| 1947 | 545 | 364 | 574 | 588 | 275 | 268 | 184 | 174 | 148 | 201 | 750 | 587 | 388.17 |
| 1948 | 502 | 1056 | 959 | 873 | 306 | 282 | 309 | 287 | 270 | 241 | 317 | 1108 | 542.5 |
| 1949 | 670 | 762 | 509 | 473 | 629 | 393 | 429 | 361 | 501 | 324 | 315 | 279 | 470.42 |
| 1950 | 329 | 318 | 379 | 300 | 212 | 262 | 222 | 178 | 292 | 228 | 233 | 267 | 268.33 |
| 1951 | 259 | 262 | 313 | 397 | 234 | 192 | 162 | 135 | 119 | 119 | 166 | 247 | 217.08 |
| 1952 | 328 | 252 | 790 | 882 | 284 | 165 | 131 | 142 | 127 | 135 | 150 | 148 | 294.5 |
| 1953 | 185 | 235 | 456 | 326 | 514 | 212 | 189 | 185 | 232 | 262 | 223 | 278 | 274.75 |
| 1954 | 277 | 240 | 308 | 399 | 253 | 200 | 188 | 168 | 166 | 167 | 183 | 172 | 226.75 |
| 1955 | 179 | 207 | 199 | 276 | 204 | 178 | 176 | 176 | 186 | 164 | 176 | 191 | 192.67 |
| 1956 | 165 | 211 | 258 | 281 | 223 | 178 | 170 | 179 | 195 | 195 | 187 | 206 | 204 |
| 1957 | 214 | 219 | 241 | 286 | 339 | 229 | 196 | 189 | 215 | 289 | 243 | 485 | 262.08 |
| 1958 | 435 | 528 | 553 | 781 | 490 | 240 | 282 | 244 | 179 | 170 | 175 | 193 | 355.83 |
| 1959 | 226 | 336 | 342 | 282 | 191 | 398 | 221 | 225 | 278 | 407 | 545 | 349 | 316.67 |
| 1960 | 451 | 975 | 834 | 768 | 382 | 233 | 228 | 257 | 214 | 216 | 199 | 214 | 414.25 |
| 1961 | 240 | 282 | 557 | 724 | 429 | 221 | 317 | 283 | 312 | 185 | 196 | 352 | 341.5 |
| 1962 | 609 | 345 | 598 | 564 | 336 | 283 | 205 | 207 | 206 | 227 | 221 | 224 | 335.42 |
| 1963 | 334 | 457 | 491 | 414 | 468 | 326 | 468 | 271 | 252 | 245 | 234 | 336 | 358 |
| 1964 | 556 | 695 | 826 | 1576 | 959 | 266 | 313 | 443 | 666 | 598 | 473 | 509 | 656.67 |
| 1965 | 698 | 491 | 631 | 787 | 398 | 379 | 374 | 357 | 274 | 251 | 246 | 246 | 427.67 |
| 1966 | 336 | 404 | 953 | 330 | 379 | 390 | 257 | 248 | 226 | 217 | 217 | 227 | 348.67 |
| 1967 | 355 | 313 | 368 | 238 | 253 | 452 | 344 | 271 | 345 | 217 | 251 | 443 | 320.83 |
| 1968 | 668 | 358 | 260 | 255 | 250 | 306 | 235 | 227 | 211 | 214 | 229 | 228 | 286.75 |
| 1969 | 273 | 520 | 372 | 500 | 632 | 257 | 226 | 243 | 263 | 216 | 218 | 236 | 329.67 |
| 1970 | 248 | 267 | 318 | 356 | 220 | 210 | 216 | 224 | 210 | 216 | 236 | 244 | 247.08 |
| 1971 | 305 | 313 | 718 | 432 | 352 | 271 | 258 | 343 | 272 | 265 | 265 | 537 | 360.92 |
| 1972 | 584 | 737 | 350 | 290 | 305 | 295 | 368 | 235 | 220 | 207 | 215 | 318 | 343.67 |
| 1973 | 588 | 767 | 651 | 988 | 426 | 786 | 415 | 302 | 244 | 235 | 232 | 296 | 494.17 |
| 1974 | 512 | 764 | 486 | 488 | 268 | 253 | 236 | 279 | 246 | 215 | 222 | 243 | 351 |
| 1975 | 392 | 635 | 918 | 1050 | 481 | 406 | 336 | 267 | 275 | 325 | 435 | 440 | 496.67 |
| 1976 | 338 | 414 | 441 | 514 | 323 | 609 | 462 | 243 | 242 | 314 | 299 | 685 | 407 |
| 1977 | 562 | 321 | 454 | 726 | 278 | 225 | 215 | 229 | 213 | 215 | 336 | 407 | 348.42 |
| 1978 | 443 | 754 | 351 | 286 | 393 | 279 | 220 | 211 | 201 | 188 | 191 | 207 | 310.33 |
| 1979 | 231 | 290 | 736 | 676 | 555 | 500 | 275 | 255 | 262 | 287 | 333 | 404 | 400.33 |
| 1980 | 355 | 567 | 782 | 1182 | 372 | 436 | 240 | 204 | 196 | 222 | 226 | 220 | 416.83 |
| 1981 | 220 | 264 | 231 | 231 | 176 | 216 | 172 | 190 | 175 | 159 | 150 | 183 | 197.25 |
| 1982 | 350 | 353 | 324 | 242 | 251 | 206 | 205 | 203 | 204 | 217 | 186 | 247 | 249 |
| 1983 | 429 | 599 | 674 | 890 | 363 | 301 | 223 | 202 | 209 | 190 | 187 | 297 | 380.33 |
| 1984 | 390 | 466 | 775 | 478 | 717 | 299 | 252 | 534 | 234 | -9999 | -9999 | -9999 | -9999 |
| |
|
|
|
|
|
|
|
|
|
|
|
|
|
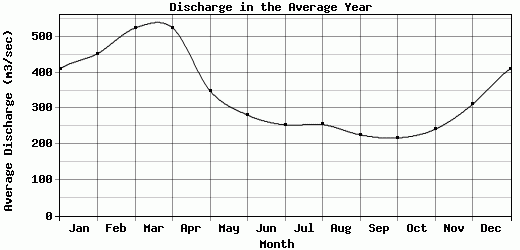
| Avg | 410.24 | 452.96 | 524.41 | 525.22 | 349.16 | 281.31 | 253.71 | 255.04 | 226.16 | 217.2 | 241.4 | 311.12 | 335.88 |
| |
|
|
|
|
|
|
|
|
|
|
|
|
|
| Std Dev | 179.98 |
206.22 |
220.96 |
281.52 |
150.31 |
118.07 |
97.19 |
123.69 |
91.44 |
84.68 |
113.29 |
166.91 |
91.99 |
| |
|
|
|
|
|
|
|
|
|
|
|
|
|
| | Jan | Feb | Mar | Apr | May | Jun | Jul | Aug | Sep | Oct | Nov | Dec | Avg Annual |
Click here for this table in tab-delimited format.
Tab-delimited format will open in most table browsing software, i.e. Excel, etc.
View this station on the map.
Return to start.