Results
| Country: | Morocco
| | Station: | AzibSoltane | | River: | Sebou | | Area: | 17250 km2 | | Lat: | 34.28 | | Lon: | -5.43 | | Source: | RivDIS | | PointID: | 68 | | Area Units: | km2 | | Discharge Units: | m3/sec | | Starting Year: | 1959 | | Ending Year: | 1989 | | Total Years: | 31 | | Total Usable Years: | 29 | |
| |
| Year | Jan | Feb | Mar | Apr | May | Jun | Jul | Aug | Sep | Oct | Nov | Dec | Avg Annual |
|---|
| 1959 | -9999 | -9999 | -9999 | -9999 | -9999 | -9999 | -9999 | -9999 | 12.5 | 14.2 | 20.6 | 107 | -9999 |
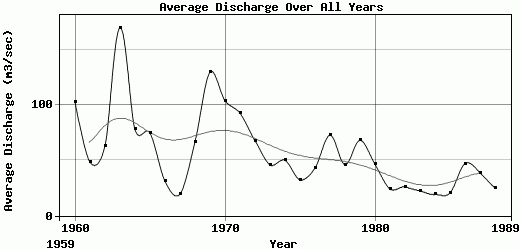
| 1960 | 275 | 145 | 293 | 144 | 69.6 | 58 | 30.5 | 20.3 | 16.3 | 25.8 | 37.6 | 115 | 102.51 |
| 1961 | 134 | 95.6 | 62.6 | 66.5 | 37 | 32.1 | 15.7 | 11.4 | 11.5 | 18.6 | 42.6 | 50.8 | 48.2 |
| 1962 | 42.3 | 28.3 | 214 | 103 | 51.8 | 30.5 | 15.2 | 10.8 | 10.6 | 18.6 | 148 | 81 | 62.84 |
| 1963 | 488 | 594 | 199 | 80.9 | 147 | 96.9 | 44.5 | 33.8 | 27.5 | 26.9 | 31.2 | 264 | 169.48 |
| 1964 | 83.7 | 98.9 | 131 | 293 | 65.2 | 41.8 | 30 | 23.8 | 22.2 | 23.2 | 50.5 | 71.1 | 77.87 |
| 1965 | 136 | 125 | 227 | 120 | 58.9 | 40.5 | 28.2 | 21.3 | 22.5 | 33.1 | 40.6 | 39.5 | 74.38 |
| 1966 | 55.2 | 68.4 | 42.7 | 30.8 | 19.9 | 14.3 | 8.9 | 8.6 | 10.2 | 56.1 | 32.9 | 23.9 | 30.99 |
| 1967 | 19.2 | 26.2 | 28.5 | 27.7 | 23.5 | 17.5 | 7.3 | 5.6 | 7.1 | 17.4 | 25.2 | 29.4 | 19.55 |
| 1968 | 33.8 | 89.8 | 177 | 122 | 70.3 | 34.3 | 16.6 | 12.6 | 11 | 10.6 | 57.8 | 161 | 66.4 |
| 1969 | 245 | 358 | 342 | 156 | 92.5 | 63.5 | 40 | 29 | 29 | 35 | 47 | 116 | 129.42 |
| 1970 | 690 | 121 | 135 | 95 | 46.5 | 32 | 21.5 | 18.5 | 17.5 | 20 | 21.5 | 26.5 | 103.75 |
| 1971 | 130 | 93.5 | 90.5 | 300 | 173 | 97.5 | 43 | 29.5 | 26 | 24.5 | 49 | 53 | 92.46 |
| 1972 | 89.5 | 120 | 189 | 100 | 88.5 | 45.5 | 28.5 | 21 | 20 | 44.5 | 30 | 36 | 67.71 |
| 1973 | 55.5 | 97 | 90.5 | 74.5 | 43.5 | 25.5 | 17.5 | 20 | 25 | 28 | 27.5 | 46 | 45.88 |
| 1974 | 26 | 43.5 | 57.5 | 123 | 100 | 31.5 | 36 | 37.5 | 38.5 | 46 | 45.5 | 15 | 50 |
| 1975 | 17 | 24.5 | 51.5 | 70.5 | 53.5 | 31.5 | 22.5 | 24.5 | 25 | 25.5 | 21 | 23 | 32.5 |
| 1976 | 15.5 | 45 | 36.6 | 61.1 | 96.2 | 34.7 | 27.2 | 29.6 | 32.8 | 33.2 | 33.6 | 70.3 | 42.98 |
| 1977 | 222 | 306 | 85.2 | 45.2 | 31.1 | 32.1 | 24.4 | 25 | 24.7 | 25.7 | 21.9 | 28.4 | 72.64 |
| 1978 | 31.9 | 72.8 | 80.1 | 75.6 | 77.5 | 33.7 | 33.8 | 30.7 | 35.3 | 27.6 | 23.8 | 28.1 | 45.91 |
| 1979 | 39.3 | 240 | 143 | 83.9 | 33.6 | 25.7 | 26.5 | 30.7 | 37.8 | 54.5 | 64.8 | 36 | 67.98 |
| 1980 | 33.1 | 26.5 | 45.9 | 29 | 36.9 | 27 | 227.1 | 30.5 | 29.8 | 27.1 | 24 | 18.7 | 46.3 |
| 1981 | 17.9 | 18.9 | 18.5 | 34.2 | 26.5 | 20.5 | 23.2 | 27.8 | 27.2 | 23.3 | 21.3 | 29.1 | 24.03 |
| 1982 | 31.9 | 29.1 | 24.4 | 44.3 | 30.3 | 18.8 | 17.3 | 17.8 | 19.1 | 32.4 | 20.4 | 24.9 | 25.89 |
| 1983 | 21.5 | 41.9 | 24.7 | 20 | 15.5 | 17.1 | 18.3 | 22.4 | 19.1 | 18.9 | 16.8 | 31.7 | 22.33 |
| 1984 | 14.5 | 12 | 17.1 | 16.3 | 41.4 | 17.9 | 18.2 | 23 | 18.3 | 15.1 | 19.2 | 15.4 | 19.03 |
| 1985 | 27.8 | 29.9 | 18.6 | 15.7 | 22.6 | 13.6 | 19.4 | 21 | 22.9 | 17.8 | 22.8 | 13.2 | 20.44 |
| 1986 | 46.9 | 177 | 92.1 | 61.3 | 34.7 | 24.4 | 19.3 | 23.5 | 30.2 | 21.9 | 19 | 13 | 46.94 |
| 1987 | 31.3 | 122 | 40.7 | 19.8 | 19.4 | 34.6 | 49.4 | 44.3 | 37.4 | 30.1 | 16.6 | 19.1 | 38.73 |
| 1988 | 31.7 | 30.2 | 37.2 | 17.1 | 21.7 | 28.5 | 28.3 | 29.3 | 27.5 | 18.7 | 15.2 | 12.3 | 24.81 |
| 1989 | 12.5 | -9999 | -9999 | -9999 | -9999 | -9999 | -9999 | -9999 | -9999 | -9999 | -9999 | -9999 | -9999 |
| |
|
|
|
|
|
|
|
|
|
|
|
|
|
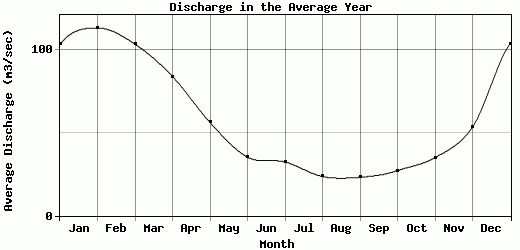
| Avg | 103.27 | 113.1 | 103.27 | 83.81 | 56.14 | 35.22 | 32.36 | 23.58 | 23.15 | 27.14 | 34.93 | 53.28 | 57.65 |
| |
|
|
|
|
|
|
|
|
|
|
|
|
|
| Std Dev | 149.34 |
123.16 |
85.71 |
70.06 |
37.51 |
20.35 |
38.15 |
8.54 |
8.6 |
10.94 |
24.69 |
53.29 |
35.04 |
| |
|
|
|
|
|
|
|
|
|
|
|
|
|
| | Jan | Feb | Mar | Apr | May | Jun | Jul | Aug | Sep | Oct | Nov | Dec | Avg Annual |
Click here for this table in tab-delimited format.
Tab-delimited format will open in most table browsing software, i.e. Excel, etc.
View this station on the map.
Return to start.