Results
| Country: | France
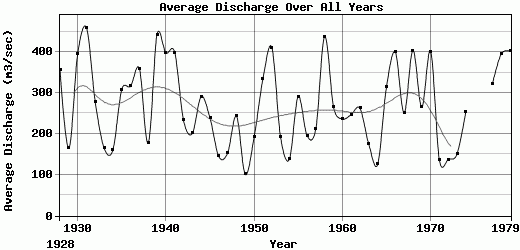
| | Station: | Paris | | River: | Seine | | Area: | 44320 km2 | | Lat: | 48.83 | | Lon: | 2.25 | | Source: | RivDIS | | PointID: | 739 | | Area Units: | km2 | | Discharge Units: | m3/sec | | Starting Year: | 1928 | | Ending Year: | 1979 | | Total Years: | 52 | | Total Usable Years: | 50 | |
| |
| Year | Jan | Feb | Mar | Apr | May | Jun | Jul | Aug | Sep | Oct | Nov | Dec | Avg Annual |
|---|
| 1928 | 600 | 907 | 355 | 476 | 441 | 269 | 118 | 80 | 65 | 86 | 301 | 590 | 357.33 |
| 1929 | 419 | 241 | 140 | 128 | 119 | 115 | 90 | 59 | 48 | 51 | 143 | 433 | 165.5 |
| 1930 | 653 | 343 | 458 | 341 | 385 | 310 | 248 | 208 | 151 | 624 | 113 | 903 | 394.75 |
| 1931 | 866 | 916 | 1057 | 443 | 485 | 243 | 145 | 190 | 409 | 159 | 212 | 386 | 459.25 |
| 1932 | 647 | 230 | 223 | 565 | 351 | 284 | 149 | 96 | 78 | 135 | 335 | 238 | 277.58 |
| 1933 | 209 | 278 | 292 | 156 | 185 | 140 | 119 | 94 | 108 | 77 | 192 | 136 | 165.5 |
| 1934 | 241 | 198 | 431 | 255 | 173 | 80 | 65 | 59 | 59 | 60 | 80 | 224 | 160.42 |
| 1935 | 333 | 743 | 679 | 406 | 333 | 187 | 81 | 66 | 63 | 60 | 119 | 628 | 308.17 |
| 1936 | 1045 | 750 | 355 | 274 | 174 | 94 | 178 | 244 | 121 | 113 | 224 | 223 | 316.25 |
| 1937 | 395 | 848 | 1110 | 621 | 372 | 197 | 159 | 103 | 80 | 70 | 108 | 252 | 359.58 |
| 1938 | 446 | 618 | 237 | 136 | 85 | 84 | 70 | 74 | 72 | 68 | 80 | 165 | 177.92 |
| 1939 | 510 | 391 | 498 | 416 | 345 | 194 | 118 | 126 | 132 | 565 | 1189 | 834 | 443.17 |
| 1940 | 443 | 990 | 536 | 600 | 628 | 186 | 168 | 147 | 134 | 243 | 290 | 415 | 398.33 |
| 1941 | 753 | 1221 | 739 | 490 | 251 | 327 | 170 | 156 | 116 | 111 | 222 | 233 | 399.08 |
| 1942 | 343 | 418 | 738 | 305 | 140 | 107 | 67 | 68 | 70 | 72 | 257 | 210 | 232.92 |
| 1943 | 687 | 413 | 220 | 144 | 236 | 129 | 85 | 58 | 59 | 65 | 101 | 215 | 201 |
| 1944 | 215 | 431 | 250 | 159 | 118 | 75 | 64 | 60 | 74 | 159 | 747 | 1145 | 291.42 |
| 1945 | 400 | 1284 | 383 | 193 | 144 | 100 | 58 | 55 | 65 | 52 | 52 | 77 | 238.58 |
| 1946 | 171 | 463 | 404 | 138 | 128 | 107 | 75 | 41 | 48 | 41 | 52 | 67 | 144.58 |
| 1947 | 178 | 180 | 621 | 416 | 112 | 66 | 45 | 41 | 30 | 29 | 32 | 89 | 153.25 |
| 1948 | 893 | 639 | 226 | 173 | 114 | 75 | 108 | 179 | 190 | 91 | 112 | 117 | 243.08 |
| 1949 | 242 | 171 | 120 | 88 | 68 | 77 | 62 | 44 | 70 | 60 | 62 | 147 | 100.92 |
| 1950 | 172 | 442 | 328 | 156 | 184 | 111 | 65 | 56 | 59 | 61 | 141 | 519 | 191.17 |
| 1951 | 559 | 499 | 462 | 587 | 240 | 422 | 365 | 133 | 100 | 88 | 254 | 299 | 334 |
| 1952 | 734 | 920 | 544 | 684 | 196 | 105 | 58 | 62 | 72 | 127 | 430 | 1005 | 411.42 |
| 1953 | 551 | 494 | 305 | 169 | 127 | 132 | 137 | 98 | 87 | 72 | 70 | 58 | 191.67 |
| 1954 | 103 | 139 | 210 | 185 | 109 | 76 | 64 | 80 | 105 | 111 | 126 | 347 | 137.92 |
| 1955 | 1120 | 950 | 498 | 277 | 129 | 108 | 73 | 68 | 62 | 58 | 58 | 95 | 291.33 |
| 1956 | 303 | 315 | 263 | 236 | 179 | 141 | 95 | 74 | 162 | 147 | 171 | 260 | 195.5 |
| 1957 | 257 | 559 | 595 | 216 | 110 | 92 | 81 | 86 | 95 | 121 | 149 | 182 | 211.92 |
| 1958 | 523 | 879 | 893 | 345 | 525 | 374 | 231 | 161 | 165 | 191 | 349 | 612 | 437.33 |
| 1959 | 1265 | 543 | 282 | 299 | 273 | 127 | 92 | 77 | 61 | 54 | 46 | 70 | 265.75 |
| 1960 | 190 | 224 | 314 | 119 | 80 | 55 | 53 | 160 | 233 | 331 | 568 | 514 | 236.75 |
| 1961 | 737 | 795 | 341 | 198 | 144 | 94 | 56 | 35 | 42 | 46 | 125 | 354 | 247.25 |
| 1962 | 520 | 575 | 400 | 682 | 394 | 180 | 89 | 51 | 44 | 42 | 61 | 108 | 262.17 |
| 1963 | 172 | 94 | 227 | 278 | 166 | 216 | 142 | 113 | 121 | 90 | 260 | 212 | 174.25 |
| 1964 | 126 | 158 | 276 | 316 | 173 | 81 | 57 | 45 | 55 | 50 | 75 | 91 | 125.25 |
| 1965 | 309 | 297 | 327 | 457 | 324 | 256 | 104 | 78 | 173 | 209 | 226 | 1006 | 313.83 |
| 1966 | 1033 | 956 | 494 | 469 | 329 | 166 | 174 | 133 | 96 | 108 | 139 | 700 | 399.75 |
| 1967 | 661 | 460 | 402 | 238 | 163 | 120 | 99 | 67 | 89 | 112 | 271 | 335 | 251.42 |
| 1968 | 1271 | 709 | 468 | 300 | 409 | 198 | 136 | 140 | 335 | 314 | 259 | 304 | 403.58 |
| 1969 | 413 | 396 | 501 | 324 | 403 | 275 | 201 | 134 | 106 | 92 | 133 | 212 | 265.83 |
| 1970 | 279 | 1117 | 1124 | 772 | 447 | 210 | 195 | 128 | 87 | 120 | 139 | 194 | 401 |
| 1971 | 160 | 290 | 185 | 150 | 130 | 165 | 98 | 84 | 78 | 77 | 99 | 110 | 135.5 |
| 1972 | 111 | 149 | 111 | 118 | 112 | 103 | 85 | 165 | 108 | 83 | 256 | 243 | 137 |
| 1973 | 125 | 424 | 212 | 130 | 135 | 125 | 75 | 70 | 65 | 80 | 90 | 280 | 150.92 |
| 1974 | 291 | 360 | 375 | 250 | 125 | 71 | 62 | 56 | 71 | 295 | 461 | 636 | 254.42 |
| 1975 | -9999 | -9999 | -9999 | -9999 | -9999 | -9999 | -9999 | -9999 | -9999 | -9999 | -9999 | -9999 | -9999 |
| 1976 | 181 | 382 | 178 | 94 | 80 | -9999 | -9999 | -9999 | 62 | 53 | 86 | 236 | -9999 |
| 1977 | 205 | 910 | 516 | 311 | 311 | 232 | 181 | 196 | 168 | 139 | 304 | 384 | 321.42 |
| 1978 | 510 | 1050 | 940 | 890 | 420 | 230 | 190 | 140 | 115 | 95 | 60 | 97 | 394.75 |
| 1979 | 290 | 850 | 850 | 730 | 410 | 410 | 140 | 120 | 110 | 150 | 290 | 480 | 402.5 |
| |
|
|
|
|
|
|
|
|
|
|
|
|
|
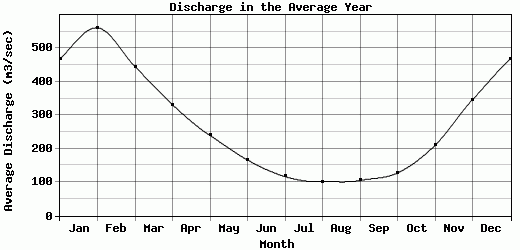
| Avg | 467.84 | 560.96 | 444.96 | 331.43 | 239.49 | 166.42 | 116.8 | 101.16 | 105.25 | 127.59 | 210.18 | 346.47 | 270.68 |
| |
|
|
|
|
|
|
|
|
|
|
|
|
|
| Std Dev | 305.51 |
312.48 |
252.68 |
197.57 |
137.4 |
91.69 |
61.82 |
49.81 |
68.55 |
116.14 |
196.71 |
267.06 |
100.55 |
| |
|
|
|
|
|
|
|
|
|
|
|
|
|
| | Jan | Feb | Mar | Apr | May | Jun | Jul | Aug | Sep | Oct | Nov | Dec | Avg Annual |
Click here for this table in tab-delimited format.
Tab-delimited format will open in most table browsing software, i.e. Excel, etc.
View this station on the map.
Return to start.