Results
| Country: | Mali
| | Station: | Kayes | | River: | Senegal | | Area: | 157400 km2 | | Lat: | 14.51 | | Lon: | -11.59 | | Source: | RivDIS | | PointID: | 1191 | | Area Units: | km2 | | Discharge Units: | m3/sec | | Starting Year: | 1977 | | Ending Year: | 2013 | | Total Years: | 37 | | Total Usable Years: | 37 | |
| |
| Year | Jan | Feb | Mar | Apr | May | Jun | Jul | Aug | Sep | Oct | Nov | Dec | Avg Annual |
|---|
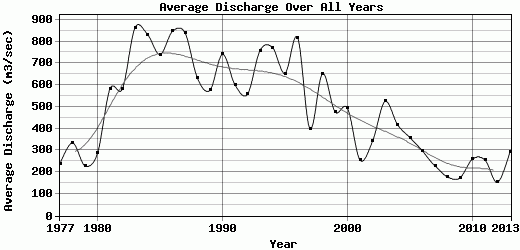
| 1977 | 79.3 | 39.5 | 20.9 | 7.7 | 3.8 | 3 | 220 | 691 | 1090 | 492 | 149 | 53.6 | 237.48 |
| 1978 | 27.9 | 14.9 | 5.3 | 3 | 1.9 | 17.6 | 286 | 1067 | 1263 | 900 | 323 | 108 | 334.8 |
| 1979 | 50 | 22.9 | 10.5 | 3.7 | 3.3 | 59.4 | 244 | 766 | 862 | 428 | 223 | 76.6 | 229.12 |
| 1980 | 36.6 | 17.6 | 7 | 3.8 | 1 | 28.2 | 264 | 1083 | 1401 | 370 | 155 | 66.8 | 286.17 |
| 1981 | 190 | 116 | 58 | 24.5 | 7.4 | 31.8 | 506 | 1301 | 2130 | 1966 | 459 | 201 | 582.56 |
| 1982 | 101 | 51.2 | 306 | 15.4 | 2.9 | 154 | 880 | 1477 | 2332 | 1070 | 411 | 199 | 583.29 |
| 1983 | 123 | 63.4 | 31.7 | 10.4 | 18.6 | 230 | 1001 | 3500 | 3073 | 1357 | 592 | 347 | 862.26 |
| 1984 | 172 | 91.3 | 47.8 | 32.7 | 37.1 | 195 | 645 | 2803 | 3106 | 1870 | 674 | 312 | 832.16 |
| 1985 | 171 | 97.1 | 46.4 | 18.8 | 8.6 | 46.3 | 467 | 2164 | 3356 | 1725 | 536 | 238 | 739.52 |
| 1986 | 129 | 68.3 | 37.4 | 15.6 | 5.6 | 211 | 559 | 2485 | 3168 | 2371 | 796 | 309 | 846.24 |
| 1987 | 163 | 90 | 44 | 20.7 | 13.8 | 164 | 514 | 3538 | 2902 | 1560 | 691 | 370 | 839.21 |
| 1988 | 188 | 103 | 53.8 | 24 | 17.5 | 163 | 467 | 2123 | 2871 | 974 | 398 | 178 | 630.03 |
| 1989 | 96.5 | 50.2 | 25.4 | 10.2 | 2.1 | 734 | 775 | 1456 | 2076 | 1089 | 423 | 174 | 575.95 |
| 1990 | 88.8 | 49.4 | 26.3 | 8.5 | 2 | 80.6 | 742 | 2674 | 3584 | 1072 | 395 | 167 | 740.8 |
| 1991 | 86.2 | 46.5 | 22.3 | 5.8 | 1.8 | 79.7 | 471 | 1915 | 2508 | 1341 | 509 | 220 | 600.53 |
| 1992 | 109 | 57 | 27.3 | 10.1 | 5.2 | 8.6 | 399 | 1322 | 2230 | 1769 | 556 | 195 | 557.35 |
| 1993 | 98.2 | 47.7 | 23.5 | 6.5 | 2.1 | 139 | 554 | 2056 | 3988 | 1462 | 491 | 229 | 758.08 |
| 1994 | 129 | 67.3 | 33 | 12.3 | 3.6 | 85.1 | 509 | 2612 | 3559 | 1497 | 536 | 222 | 772.11 |
| 1995 | 127 | 64.7 | 35.5 | 16.2 | 9.8 | 45.1 | 320 | 1323 | 2330 | 2633 | 674 | 257 | 652.94 |
| 1996 | 138 | 78.9 | 40.7 | 17.8 | 8.2 | 79.1 | 530 | 2229 | 3783 | 1988 | 631 | 293 | 818.06 |
| 1997 | 173 | 104 | 55.6 | 24.4 | 13.8 | 83.6 | 413 | 1045 | 1715 | 740 | 268 | 150 | 398.78 |
| 1998 | 74.4 | 40 | 18.6 | 4.7 | 1.8 | 30 | 629 | 1471 | 2757 | 1763 | 763 | 272 | 652.04 |
| 1999 | 136 | 72.6 | 34 | 16.5 | 6.5 | 30.1 | 296 | 1909 | 2150 | 691 | 256 | 125 | 476.89 |
| 2000 | 64 | 37.1 | 18.4 | 6.6 | 2.2 | 14.5 | 460 | 2206 | 2114 | 666 | 230 | 108 | 493.9 |
| 2001 | 53 | 29.2 | 14 | 5.1 | 2.9 | 70.6 | 302 | 770 | 1017 | 485 | 206 | 109 | 255.32 |
| 2002 | 50.6 | 26.9 | 11 | 2.9 | 2.2 | 121 | 336 | 1592 | 1209 | 469 | 171 | 98.2 | 340.82 |
| 2003 | 36 | 20.4 | 9.5 | 3.9 | 1.4 | 19.2 | 566 | 2218 | 2082 | 952 | 272 | 112 | 524.37 |
| 2004 | 53.1 | 31.1 | 16.5 | 7.4 | 2.6 | 0.9 | 431 | 1107 | 2111 | 845 | 291 | 120 | 418.05 |
| 2005 | 57.3 | 31.5 | 14.4 | 3.3 | 2.5 | 13.9 | 389 | 1118 | 910 | 871 | 694 | 189 | 357.83 |
| 2006 | 30.5 | 16 | 7 | 3.6 | 2 | 53.1 | 355 | 1292 | 1027 | 501 | 180 | 95.9 | 296.93 |
| 2007 | 31.4 | 18 | 6.7 | 3.9 | 2.6 | 0.6 | 201 | 905 | 966 | 390 | 164 | 54.1 | 228.61 |
| 2008 | 26.4 | 15 | 6.5 | 3.6 | 2.6 | 20.1 | 288 | 577 | 686 | 350 | 115 | 43.6 | 177.82 |
| 2009 | 22.4 | 11.6 | 5.8 | 3.5 | 1.2 | 30.3 | 390 | 578 | 444 | 448 | 106 | 38.3 | 173.26 |
| 2010 | 18.3 | 9.7 | 5.2 | 3.5 | 0.8 | 0.3 | 256 | 1070 | 1174 | 427 | 116 | 40.1 | 260.08 |
| 2011 | 17.4 | 10.4 | 4.6 | 3.7 | 1.4 | 0.4 | 235 | 593 | 1364 | 578 | 194 | 62.4 | 255.36 |
| 2012 | 30 | 16.1 | 8.4 | 4.7 | 2.5 | 9.7 | 92 | 326 | 752 | 474 | 61.9 | 47.8 | 152.09 |
| 2013 | 67.7 | 50.2 | 40.9 | 4.1 | 64.9 | 58.1 | 208 | 566 | 1923 | 495 | 41.2 | 11.8 | 294.24 |
| |
|
|
|
|
|
|
|
|
|
|
|
|
|
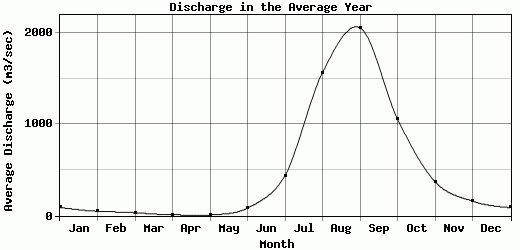
| Avg | 87.7 | 48.02 | 31.89 | 10.08 | 7.3 | 84.08 | 437.84 | 1565.62 | 2054.41 | 1056.19 | 371.65 | 159.28 | 492.84 |
| |
|
|
|
|
|
|
|
|
|
|
|
|
|
| Std Dev | 52.8 |
29.89 |
48.38 |
7.71 |
11.82 |
125.44 |
195.23 |
811.52 |
972.48 |
616.76 |
216.83 |
95.05 |
225 |
| |
|
|
|
|
|
|
|
|
|
|
|
|
|
| | Jan | Feb | Mar | Apr | May | Jun | Jul | Aug | Sep | Oct | Nov | Dec | Avg Annual |
Click here for this table in tab-delimited format.
Tab-delimited format will open in most table browsing software, i.e. Excel, etc.
View this station on the map.
Return to start.