Results
| Country: | Korea
| | Station: | SingJeung | | River: | SeomJin | | Area: | 4480 km2 | | Lat: | 35.18 | | Lon: | 127.56 | | Source: | RivDIS | | PointID: | 920 | | Area Units: | km2 | | Discharge Units: | m3/sec | | Starting Year: | 1976 | | Ending Year: | 1979 | | Total Years: | 4 | | Total Usable Years: | 4 | |
| |
| Year | Jan | Feb | Mar | Apr | May | Jun | Jul | Aug | Sep | Oct | Nov | Dec | Avg Annual |
|---|
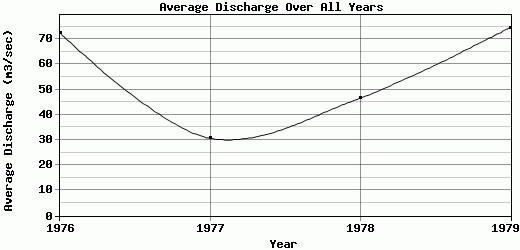
| 1976 | 50 | 80 | 70 | 60 | 110 | 110 | 60 | 130 | 70 | 50 | 40 | 40 | 72.5 |
| 1977 | 30 | 10 | 10 | 100 | 50 | 30 | 30 | 50 | 30 | 10 | 10 | 8 | 30.67 |
| 1978 | 15 | 30 | 30 | 2 | 1 | 120 | 140 | 110 | 40 | 30 | 30 | 10 | 46.5 |
| 1979 | 2 | 30 | 10 | 50 | 50 | 110 | 100 | 400 | 120 | 15 | 3 | 3 | 74.42 |
| |
|
|
|
|
|
|
|
|
|
|
|
|
|
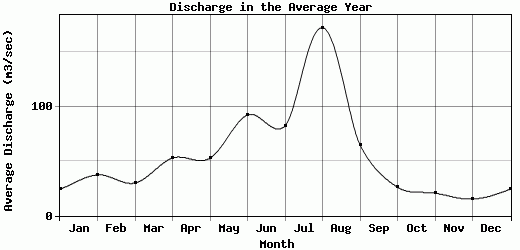
| Avg | 24.25 | 37.5 | 30 | 53 | 52.75 | 92.5 | 82.5 | 172.5 | 65 | 26.25 | 20.75 | 15.25 | 56.02 |
| |
|
|
|
|
|
|
|
|
|
|
|
|
|
| Std Dev | 17.87 |
25.86 |
24.49 |
34.89 |
38.64 |
36.31 |
41.46 |
134.61 |
35 |
15.56 |
14.89 |
14.52 |
18.33 |
| |
|
|
|
|
|
|
|
|
|
|
|
|
|
| | Jan | Feb | Mar | Apr | May | Jun | Jul | Aug | Sep | Oct | Nov | Dec | Avg Annual |
Click here for this table in tab-delimited format.
Tab-delimited format will open in most table browsing software, i.e. Excel, etc.
View this station on the map.
Return to start.