Results
| Country: | U.S.A.
| | Station: | COOPERSTOWN, ND | | River: | SHEYENNE RIVER | | Area: | 23360941.08 | | Lat: | 47.43 | | Lon: | -98.02 | | Source: | USGS | | PointID: | 5057000 | | Area Units: | km2 | | Discharge Units: | m3/sec | | Starting Year: | 1962 | | Ending Year: | 1971 | | Total Years: | 10 | | Total Usable Years: | 9 | |
| |
| Year | Jan | Feb | Mar | Apr | May | Jun | Jul | Aug | Sep | Oct | Nov | Dec | Avg Annual |
|---|
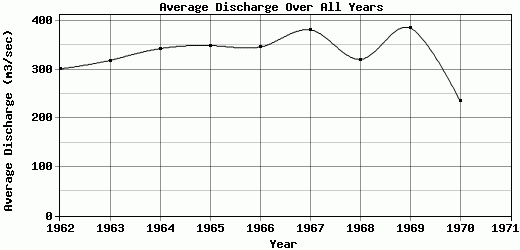
| 1962 | 82.67 | 111.75 | 78.28 | 320.83 | 660.88 | 1032.34 | 503.04 | 263.2 | 163.49 | 146.93 | 138.53 | 113.77 | 301.31 |
| 1963 | 70.99 | 119.13 | 94.64 | 177.7 | 696.96 | 1112.86 | 722.81 | 289.28 | 188.17 | 141.92 | 126.48 | 86.49 | 318.95 |
| 1964 | 77.73 | 67.38 | 67.37 | 144.88 | 681.94 | 1445.3 | 680.25 | 279.29 | 200.74 | 222.97 | 152.02 | 98.56 | 343.2 |
| 1965 | 89.43 | 94.05 | 96.93 | 269.96 | 724.09 | 1279.08 | 649.19 | 313.75 | 219.61 | 193.66 | 155.7 | 108.99 | 349.54 |
| 1966 | 98.01 | 94.76 | 97.78 | 281.46 | 888.4 | 1214.89 | 682.53 | 276.02 | 172.24 | 130.79 | 114.93 | 104.73 | 346.38 |
| 1967 | 88.92 | 95.97 | 79.87 | 132.88 | 712.04 | 1813.33 | 838.46 | 306.31 | 173.66 | 138.97 | 118.24 | 82.51 | 381.76 |
| 1968 | 87.14 | 91.87 | 106.02 | 111.72 | 670.2 | 1192.81 | 650.74 | 281.56 | 212.92 | 188.94 | 156.1 | 100.97 | 320.92 |
| 1969 | 90.07 | 76.56 | 92.93 | 421.02 | 1106.74 | 1338.64 | 711.3 | 258.52 | 171.06 | 160.64 | 119.12 | 84.43 | 385.92 |
| 1970 | 64.76 | 77.97 | 76.59 | 99.15 | 566.89 | 925.02 | 378.44 | 193.32 | 149.37 | 128.7 | 95.85 | 81.21 | 236.44 |
| 1971 | -9999 | -9999 | -9999 | -9999 | -9999 | -9999 | -9999 | -9999 | -9999 | -9999 | -9999 | -9999 | -9999 |
| |
|
|
|
|
|
|
|
|
|
|
|
|
|
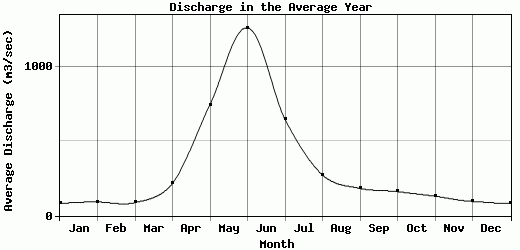
| Avg | 83.3 | 92.16 | 87.82 | 217.73 | 745.35 | 1261.59 | 646.31 | 273.47 | 183.47 | 161.5 | 130.77 | 95.74 | 331.6 |
| |
|
|
|
|
|
|
|
|
|
|
|
|
|
| Std Dev | 9.85 |
15.62 |
11.95 |
104.43 |
150.41 |
244.78 |
125.51 |
33.01 |
22.19 |
31.07 |
19.88 |
11.63 |
42.67 |
| |
|
|
|
|
|
|
|
|
|
|
|
|
|
| | Jan | Feb | Mar | Apr | May | Jun | Jul | Aug | Sep | Oct | Nov | Dec | Avg Annual |
Click here for this table in tab-delimited format.
Tab-delimited format will open in most table browsing software, i.e. Excel, etc.
View this station on the map.
Return to start.