Results
| Country: | Canada
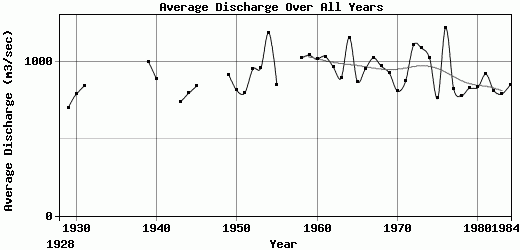
| | Station: | Usk | | River: | Skeena | | Area: | 42200 km2 | | Lat: | 54.57 | | Lon: | -128.42 | | Source: | RivDIS | | PointID: | 1110 | | Area Units: | km2 | | Discharge Units: | m3/sec | | Starting Year: | 1928 | | Ending Year: | 1984 | | Total Years: | 57 | | Total Usable Years: | 50 | |
| |
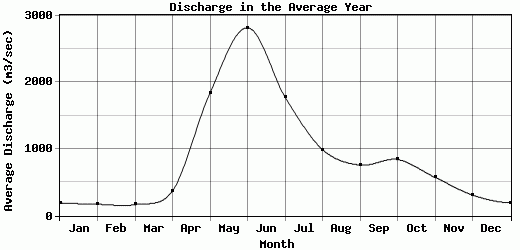
| Year | Jan | Feb | Mar | Apr | May | Jun | Jul | Aug | Sep | Oct | Nov | Dec | Avg Annual |
|---|
| 1928 | -9999 | -9999 | -9999 | -9999 | -9999 | 2740 | 1560 | 797 | 521 | 437 | 221 | 168 | -9999 |
| 1929 | 116 | 136 | 134 | 174 | 1140 | 2170 | 1340 | 1000 | 600 | 657 | 594 | 330 | 699.25 |
| 1930 | 152 | 148 | 139 | 490 | 1290 | 2550 | 1640 | 921 | 557 | 623 | 555 | 410 | 789.58 |
| 1931 | 244 | 264 | 182 | 380 | 1560 | 2740 | 1900 | 1070 | 659 | 563 | 365 | 212 | 844.92 |
| 1932 | -9999 | -9999 | -9999 | -9999 | -9999 | -9999 | -9999 | -9999 | -9999 | -9999 | -9999 | -9999 | -9999 |
| 1933 | -9999 | -9999 | -9999 | -9999 | -9999 | -9999 | -9999 | -9999 | -9999 | -9999 | -9999 | -9999 | -9999 |
| 1934 | -9999 | -9999 | -9999 | -9999 | -9999 | -9999 | -9999 | -9999 | -9999 | -9999 | -9999 | -9999 | -9999 |
| 1935 | -9999 | -9999 | -9999 | -9999 | -9999 | -9999 | -9999 | -9999 | -9999 | -9999 | -9999 | -9999 | -9999 |
| 1936 | -9999 | -9999 | -9999 | -9999 | -9999 | -9999 | -9999 | -9999 | -9999 | -9999 | 1150 | 500 | -9999 |
| 1937 | -9999 | -9999 | -9999 | 501 | 1160 | 2800 | 1370 | 1010 | 695 | -9999 | 384 | 332 | -9999 |
| 1938 | -9999 | -9999 | 177 | 424 | 1550 | 2020 | 1480 | 632 | 619 | 492 | 310 | 227 | -9999 |
| 1939 | 194 | 142 | 122 | 399 | 1980 | 2820 | 2090 | 959 | 930 | 1080 | 772 | 559 | 1003.92 |
| 1940 | 184 | 178 | 173 | 640 | 1860 | 2290 | 1850 | 1420 | 690 | 852 | 387 | 179 | 891.92 |
| 1941 | -9999 | 178 | 186 | 808 | 1510 | 2200 | 1160 | 568 | 637 | 944 | 759 | 298 | -9999 |
| 1942 | -9999 | 153 | 129 | 396 | 2310 | 2430 | 1250 | 717 | 440 | 610 | 379 | 199 | -9999 |
| 1943 | 214 | 130 | 90.7 | 445 | 1160 | 2580 | 1700 | 810 | 618 | 512 | 379 | 235 | 739.48 |
| 1944 | 162 | 110 | 117 | 499 | 1603 | 2210 | 1330 | 1030 | 745 | 920 | 551 | 274 | 795.92 |
| 1945 | 275 | 172 | 983 | 154 | 2120 | 2020 | 1190 | 648 | 383 | 1330 | 623 | 228 | 843.83 |
| 1946 | 181 | 108 | 131 | 241 | 2860 | 2690 | 1620 | 902 | 496 | 438 | 257 | -9999 | -9999 |
| 1947 | -9999 | -9999 | -9999 | 656 | 2150 | 2240 | 1520 | 805 | 987 | 745 | 409 | 233 | -9999 |
| 1948 | 245 | 153 | 101 | 172 | 3600 | 2940 | 1210 | 804 | -9999 | 633 | 350 | 136 | -9999 |
| 1949 | 94.8 | 90.5 | 109 | 342 | 2200 | 2550 | 1830 | 1000 | 734 | 782 | 1040 | 249 | 918.44 |
| 1950 | 73.9 | 56.4 | 60.6 | 104 | 1120 | 3910 | 1270 | 814 | 611 | 342 | 634 | 792 | 815.66 |
| 1951 | 185 | 136 | 131 | 243 | 2400 | 2580 | 1560 | 711 | 404 | 731 | 338 | 177 | 799.67 |
| 1952 | 156 | 126 | 97.4 | 275 | 2000 | 3120 | 2170 | 978 | 728 | 1030 | 478 | 272 | 952.53 |
| 1953 | 166 | 115 | 102 | 234 | 2760 | 2710 | 1620 | 833 | 737 | 1240 | 688 | 336 | 961.75 |
| 1954 | 264 | 448 | 211 | 167 | 1930 | 3920 | 2400 | 1460 | 969 | 935 | 1090 | 504 | 1191.5 |
| 1955 | 245 | 153 | 112 | 240 | 860 | 2690 | 2470 | 1360 | 785 | 676 | 430 | 196 | 851.42 |
| 1956 | 120 | 91.4 | 81.2 | 242 | 1680 | 2040 | 1590 | 923 | 600 | 710 | 543 | -9999 | -9999 |
| 1957 | -9999 | -9999 | 116 | 265 | 3000 | 2920 | 1640 | 1420 | 828 | 511 | 637 | 431 | -9999 |
| 1958 | 297 | 197 | 192 | 530 | 2790 | 2900 | 1810 | 698 | 772 | 1070 | 715 | 327 | 1024.83 |
| 1959 | 211 | 165 | 192 | 446 | 1780 | 3340 | 2250 | 888 | 1100 | 884 | 656 | 625 | 1044.75 |
| 1960 | 175 | 181 | 192 | 505 | 1950 | 2740 | 2560 | 1230 | 700 | 1150 | 579 | 273 | 1019.58 |
| 1961 | 212 | 160 | 187 | 585 | 2430 | 3280 | 1530 | 725 | 891 | 1450 | 735 | 244 | 1035.75 |
| 1962 | 203 | 400 | 160 | 368 | 1440 | 2830 | 2240 | 1210 | 619 | 744 | 1020 | 388 | 968.5 |
| 1963 | 359 | 417 | 262 | 442 | 1700 | 2200 | 2140 | 921 | 752 | 852 | 355 | 354 | 896.17 |
| 1964 | 212 | 201 | 147 | 351 | 1190 | 4780 | 2630 | 1480 | 769 | 1390 | 538 | 233 | 1160.08 |
| 1965 | 208 | 199 | 216 | 402 | 1460 | 2760 | 1900 | 840 | 995 | 820 | 455 | 230 | 873.75 |
| 1966 | 178 | 125 | 139 | 552 | 1500 | 3060 | 2010 | 1160 | 1080 | 830 | 558 | 265 | 954.75 |
| 1967 | 174 | 174 | 130 | 200 | 1930 | 4280 | 1540 | 954 | 1190 | 1110 | 413 | 238 | 1027.75 |
| 1968 | 399 | 280 | 229 | 303 | 2250 | 2630 | 2040 | 840 | 1110 | 808 | 529 | 249 | 972.25 |
| 1969 | 145 | 123 | 117 | 271 | 1800 | 3100 | 1040 | 1230 | 1150 | 648 | 831 | 668 | 926.92 |
| 1970 | 225 | 203 | 173 | 248 | 1120 | 3010 | 1710 | 1170 | 734 | 706 | 312 | 122 | 811.08 |
| 1971 | 115 | 109 | 120 | 248 | 1470 | 3280 | 1660 | 1020 | 929 | 855 | 453 | 232 | 874.25 |
| 1972 | 133 | 117 | 167 | 279 | 2180 | 4390 | 2280 | 1280 | 578 | 1050 | 631 | 235 | 1110 |
| 1973 | 220 | 155 | 129 | 323 | 1930 | 2830 | 2120 | 1010 | 1040 | 583 | 1620 | 1130 | 1090.83 |
| 1974 | 102 | 104 | 127 | 362 | 1444 | 2653 | 2415 | 1337 | 932 | 2053 | 490 | 279 | 1024.83 |
| 1975 | 184 | 145 | 130 | 252 | 1490 | 2550 | 1890 | 975 | 606 | 434 | 311 | 214 | 765.08 |
| 1976 | 225 | 204 | 153 | 392 | 2170 | 3370 | 3420 | 1730 | 1020 | 955 | 718 | 320 | 1223.08 |
| 1977 | 190 | 201 | 179 | 799 | 1750 | 2420 | 1600 | 953 | 544 | 712 | 378 | 163 | 824.08 |
| 1978 | 126 | 122 | 101 | 367 | 1320 | 2450 | 1090 | 866 | 575 | 1130 | 994 | 248 | 782.42 |
| 1979 | 165 | 131 | 158 | 383 | 1890 | 2660 | 1850 | 804 | 673 | 816 | 244 | 190 | 830.33 |
| 1980 | 143 | 117 | 119 | 364 | 1920 | 2080 | 1200 | 797 | 861 | 1100 | 967 | 352 | 835 |
| 1981 | 343 | 236 | 208 | 341 | 2640 | 2470 | 1780 | 861 | 699 | 662 | 562 | 253 | 921.25 |
| 1982 | 169 | 155 | 126 | 188 | 1280 | 3610 | 1530 | 715 | 754 | 759 | 323 | 150 | 813.25 |
| 1983 | 162 | 153 | 156 | 458 | 1880 | 2330 | 1450 | 985 | 817 | 594 | 407 | 129 | 793.42 |
| 1984 | 129 | 156 | 231 | 425 | 1270 | 2490 | 1980 | 1240 | 781 | 974 | 316 | 203 | 849.58 |
| |
|
|
|
|
|
|
|
|
|
|
|
|
|
| Avg | 192.79 | 170.6 | 165.81 | 370.1 | 1838.76 | 2814.87 | 1777.4 | 990.6 | 757.73 | 841.8 | 574.21 | 309.63 | 917.94 |
| |
|
|
|
|
|
|
|
|
|
|
|
|
|
| Std Dev | 67.08 |
78.52 |
125.34 |
153.96 |
556.82 |
600.93 |
458.42 |
248.18 |
196.05 |
305.49 |
270.74 |
180.16 |
124.35 |
| |
|
|
|
|
|
|
|
|
|
|
|
|
|
| | Jan | Feb | Mar | Apr | May | Jun | Jul | Aug | Sep | Oct | Nov | Dec | Avg Annual |
Click here for this table in tab-delimited format.
Tab-delimited format will open in most table browsing software, i.e. Excel, etc.
View this station on the map.
Return to start.