Results
| Country: | Canada
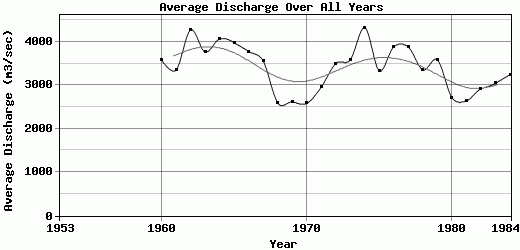
| | Station: | Fitzgerald | | River: | Slave | | Area: | 606000 km2 | | Lat: | 59.86 | | Lon: | -111.58 | | Source: | RivDIS | | PointID: | 280 | | Area Units: | km2 | | Discharge Units: | m3/sec | | Starting Year: | 1953 | | Ending Year: | 1984 | | Total Years: | 32 | | Total Usable Years: | 29 | |
| |
| Year | Jan | Feb | Mar | Apr | May | Jun | Jul | Aug | Sep | Oct | Nov | Dec | Avg Annual |
|---|
| 1953 | -9999 | 576 | 543 | 860 | 4280 | 5860 | 5240 | 4530 | 3650 | 3390 | 1870 | 1340 | -9999 |
| 1954 | 1520 | 901 | 596 | 629 | 3660 | 7710 | 7400 | 6270 | 5450 | 4930 | -9999 | -9999 | -9999 |
| 1955 | -9999 | -9999 | -9999 | -9999 | -9999 | 6140 | 6780 | 5550 | 4160 | 3540 | -9999 | -9999 | -9999 |
| 1956 | -9999 | -9999 | -9999 | -9999 | -9999 | 6020 | 5690 | 4530 | 3780 | -9999 | -9999 | -9999 | -9999 |
| 1957 | -9999 | -9999 | -9999 | -9999 | 5390 | 6240 | 5670 | 5940 | 5040 | 3890 | -9999 | -9999 | -9999 |
| 1958 | -9999 | -9999 | -9999 | -9999 | -9999 | -9999 | 5590 | 4130 | 3540 | 3550 | -9999 | -9999 | -9999 |
| 1959 | -9999 | -9999 | -9999 | -9999 | 3640 | 6090 | 6160 | 4630 | 4570 | 3770 | 2360 | 2000 | -9999 |
| 1960 | 1940 | 1040 | 717 | 937 | 3730 | 6740 | 7350 | 5740 | 5230 | 4580 | 2970 | 1990 | 3580.33 |
| 1961 | 2140 | 2250 | 1970 | 1910 | 4280 | 6920 | 5740 | 4370 | 3740 | 3510 | 1780 | 1590 | 3350 |
| 1962 | 1290 | 1040 | 752 | 1210 | 4700 | 6990 | 7720 | 6680 | 5600 | 4680 | 2800 | 7810 | 4272.67 |
| 1963 | 2160 | 2140 | 1950 | 1480 | 5480 | 7250 | 6560 | 5450 | 4580 | 4010 | 2470 | 1660 | 3765.83 |
| 1964 | 1650 | 1140 | 952 | 1020 | 4680 | 7730 | 7450 | 7290 | 5720 | 5280 | 3730 | 2170 | 4067.67 |
| 1965 | 2050 | 2100 | 1505 | 1680 | 5205 | 7110 | 7620 | 5800 | 5000 | 4600 | 2960 | 2135 | 3980.42 |
| 1966 | 2170 | 1980 | 1630 | 2170 | 4900 | 6540 | 6600 | 5750 | 5130 | 4050 | 2260 | 2170 | 3779.17 |
| 1967 | 2000 | 1690 | 1190 | 900 | 4160 | 7790 | 6680 | 5490 | 4330 | 4160 | 2610 | 1670 | 3555.83 |
| 1968 | 1600 | 1370 | 1030 | 1510 | 3720 | 4780 | 4370 | 3650 | 3030 | 2750 | 1930 | 1380 | 2593.33 |
| 1969 | 1260 | 980 | 907 | 1790 | 4950 | 4560 | 3770 | 3250 | 3500 | 3170 | 1720 | 1540 | 2616.42 |
| 1970 | 1370 | 1240 | 1300 | 1990 | 3720 | 4640 | 4070 | 3450 | 2920 | 2820 | 2010 | 1460 | 2582.5 |
| 1971 | 1440 | 1410 | 1350 | 1600 | 4420 | 4900 | 5630 | 4280 | 3570 | 3340 | 1840 | 1720 | 2958.33 |
| 1972 | 1800 | 1380 | 1350 | 1620 | 5010 | 6290 | 6400 | 5580 | 4280 | 3850 | 2400 | 2040 | 3500 |
| 1973 | 2380 | 2600 | 2450 | 2820 | 5270 | 5890 | 5720 | 5100 | 4450 | 4050 | 1430 | 858 | 3584.83 |
| 1974 | 2056 | 1991 | 1917 | 2246 | 7419 | 6938 | 6711 | 6116 | 5352 | 4955 | 3823 | 2345 | 4322.42 |
| 1975 | 2310 | 2360 | 2390 | 2610 | 4560 | 5000 | 4910 | 3680 | 3970 | 3570 | 2370 | 2270 | 3333.33 |
| 1976 | 2030 | 2130 | 2360 | 3318 | 4810 | 5090 | 5870 | 5870 | 4900 | 4300 | 3380 | 2590 | 3887.33 |
| 1977 | 2870 | 2860 | 2440 | 2730 | 4960 | 6050 | 5730 | 5030 | 4080 | 4130 | 3280 | 2390 | 3879.17 |
| 1978 | 2680 | 2760 | 2710 | 2300 | 4120 | 5320 | 4090 | 3490 | 3710 | 3870 | 2990 | 2190 | 3352.5 |
| 1979 | 2380 | 2510 | 2300 | 1910 | 4240 | 6440 | 6110 | 4330 | 3760 | 3340 | 3170 | 2530 | 3585 |
| 1980 | 1980 | 2100 | 1950 | 1970 | 2900 | 3900 | 3450 | 3020 | 3270 | 3510 | 2770 | 1800 | 2718.33 |
| 1981 | 1650 | 1680 | 1600 | 2300 | 4570 | 4440 | 3170 | 3040 | 2610 | 2740 | 1930 | 1960 | 2640.83 |
| 1982 | 1620 | 2150 | 1450 | 1580 | 3960 | 4340 | 4250 | 4070 | 3660 | 3360 | 2300 | 2250 | 2915.83 |
| 1983 | 2120 | 1650 | 1290 | 1510 | 3830 | 3920 | 5500 | 4720 | 3750 | 3430 | 2910 | 1920 | 3045.83 |
| 1984 | 2240 | 2000 | 1700 | 2150 | 3850 | 5340 | 4840 | 4060 | 3980 | 4050 | 2360 | 2350 | 3243.33 |
| |
|
|
|
|
|
|
|
|
|
|
|
|
|
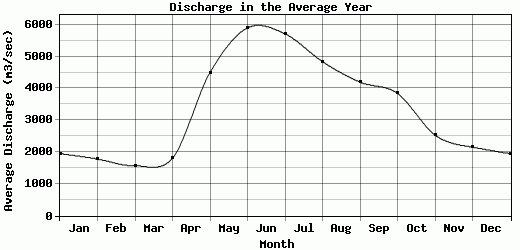
| Avg | 1950.23 | 1778.81 | 1566.63 | 1805.56 | 4497.03 | 5902.19 | 5713.78 | 4840.19 | 4197.25 | 3844.35 | 2534.19 | 2152.89 | 3404.45 |
| |
|
|
|
|
|
|
|
|
|
|
|
|
|
| Std Dev | 405.65 |
601.69 |
613.88 |
640.73 |
825.93 |
1119.27 |
1224.46 |
1092.44 |
805.19 |
631.33 |
615.77 |
1179.19 |
522.96 |
| |
|
|
|
|
|
|
|
|
|
|
|
|
|
| | Jan | Feb | Mar | Apr | May | Jun | Jul | Aug | Sep | Oct | Nov | Dec | Avg Annual |
Click here for this table in tab-delimited format.
Tab-delimited format will open in most table browsing software, i.e. Excel, etc.
View this station on the map.
Return to start.