Results
| Country: | U.S.A.
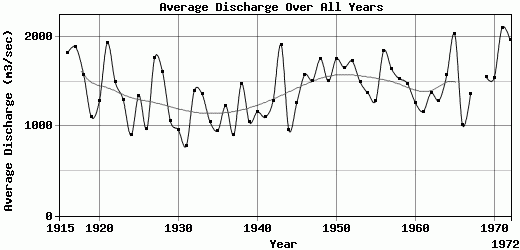
| | Station: | Clarkstone,Washington | | River: | Snake | | Area: | 267300 km2 | | Lat: | 46.43 | | Lon: | -117.16 | | Source: | RivDIS | | PointID: | 356 | | Area Units: | km2 | | Discharge Units: | m3/sec | | Starting Year: | 1915 | | Ending Year: | 1972 | | Total Years: | 58 | | Total Usable Years: | 56 | |
| |
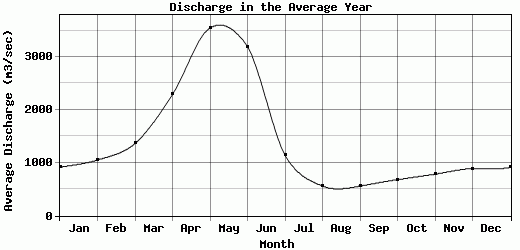
| Year | Jan | Feb | Mar | Apr | May | Jun | Jul | Aug | Sep | Oct | Nov | Dec | Avg Annual |
|---|
| 1915 | -9999 | -9999 | -9999 | -9999 | -9999 | -9999 | -9999 | -9999 | -9999 | 586 | 676 | 767 | -9999 |
| 1916 | 750 | 1430 | 2440 | 3086 | 3624 | 4445 | 2630 | 747 | 594 | 719 | 753 | 713 | 1827.58 |
| 1917 | 651 | 724 | 832 | 2758 | 5012 | 5691 | 2658 | 628 | 523 | 693 | 722 | 1721 | 1884.42 |
| 1918 | 1956 | 1226 | 1679 | 2545 | 3114 | 4105 | 1152 | 563 | 492 | 719 | 764 | 628 | 1578.58 |
| 1919 | 690 | 736 | 1186 | 2741 | 3228 | 1679 | 512 | 339 | 334 | 467 | 625 | 690 | 1102.25 |
| 1920 | 863 | 826 | 1013 | 1597 | 3058 | 3228 | 1129 | 450 | 495 | 841 | 1008 | 914 | 1285.17 |
| 1921 | 1313 | 1376 | 2327 | 2792 | 5408 | 5068 | 1231 | 557 | 535 | 628 | 838 | 1112 | 1932.08 |
| 1922 | 724 | 730 | 1118 | 2305 | 4417 | 4643 | 988 | 526 | 441 | 512 | 756 | 778 | 1494.83 |
| 1923 | 858 | 733 | 985 | 1900 | 3086 | 3398 | 1379 | 540 | 455 | 724 | 781 | 767 | 1300.5 |
| 1924 | 707 | 1027 | 846 | 1322 | 2944 | 991 | 495 | 348 | 331 | 413 | 682 | 685 | 899.25 |
| 1925 | 722 | 1427 | 1330 | 566 | 4700 | 2656 | 1146 | 515 | 549 | 784 | 832 | 900 | 1343.92 |
| 1926 | 727 | 1008 | 1234 | 2123 | 2095 | 897 | 515 | 373 | 419 | 538 | 741 | 979 | 970.75 |
| 1927 | 807 | 1115 | 1214 | 2143 | 3624 | 5238 | 1829 | 605 | 656 | 846 | 1662 | 1489 | 1769 |
| 1928 | 1373 | 1098 | 1962 | 2293 | 5889 | 2650 | 1005 | 515 | 498 | 682 | 696 | 597 | 1604.83 |
| 1929 | 605 | 532 | 1107 | 1523 | 2545 | 2647 | 846 | 441 | 441 | 529 | 662 | 775 | 1054.42 |
| 1930 | 574 | 874 | 942 | 2010 | 2120 | 1721 | 617 | 447 | 453 | 563 | 605 | 588 | 959.5 |
| 1931 | 572 | 574 | 925 | 1563 | 2154 | 1016 | 413 | 311 | 362 | 450 | 506 | 509 | 779.58 |
| 1932 | 506 | 532 | 1761 | 2531 | 4304 | 3143 | 1056 | 489 | 472 | 535 | 736 | 656 | 1393.42 |
| 1933 | 645 | 543 | 982 | 1829 | 2588 | 4757 | 1067 | 509 | 498 | 614 | 853 | 1429 | 1359.5 |
| 1934 | 1490 | 1054 | 1578 | 2643 | 1976 | 923 | 483 | 366 | 381 | 483 | 625 | 602 | 1050.33 |
| 1935 | 590 | 618 | 793 | 1633 | 2572 | 2268 | 720 | 422 | 407 | 450 | 500 | 460 | 952.75 |
| 1936 | 583 | 515 | 1089 | 3228 | 4156 | 2194 | 626 | 450 | 469 | 469 | 481 | 491 | 1229.25 |
| 1937 | 423 | 508 | 780 | 1433 | 2639 | 1769 | 627 | 419 | 409 | 474 | 571 | 770 | 901.83 |
| 1938 | 712 | 779 | 1497 | 2896 | 4029 | 3514 | 1334 | 536 | 492 | 598 | 645 | 682 | 1476.17 |
| 1939 | 651 | 668 | 1526 | 2286 | 2891 | 1312 | 658 | 424 | 451 | 515 | 522 | 623 | 1043.92 |
| 1940 | 676 | 1036 | 1619 | 2518 | 2908 | 1606 | 568 | 401 | 506 | 650 | 692 | 768 | 1162.33 |
| 1941 | 716 | 784 | 1055 | 1351 | 2210 | 2096 | 816 | 548 | 644 | 754 | 959 | 1307 | 1103.33 |
| 1942 | 825 | 936 | 986 | 2704 | 2741 | 2782 | 1124 | 540 | 534 | 568 | 805 | 908 | 1287.75 |
| 1943 | 1096 | 1239 | 1757 | 4564 | 3766 | 4604 | 2401 | 732 | 598 | 724 | 782 | 701 | 1913.67 |
| 1944 | 616 | 616 | 794 | 1501 | 2150 | 2180 | 833 | 525 | 514 | 547 | 628 | 551 | 954.58 |
| 1945 | 739 | 946 | 957 | 1452 | 3364 | 3148 | 1029 | 540 | 556 | 620 | 863 | 958 | 1264.33 |
| 1946 | 1031 | 870 | 1715 | 3182 | 3757 | 2572 | 984 | 558 | 639 | 856 | 1022 | 1744 | 1577.5 |
| 1947 | 952 | 1301 | 1410 | 2122 | 4374 | 2967 | 1006 | 583 | 608 | 844 | 953 | 1016 | 1511.33 |
| 1948 | 1178 | 1059 | 1053 | 2440 | 5269 | 5244 | 1342 | 712 | 613 | 672 | 731 | 746 | 1754.92 |
| 1949 | 746 | 1083 | 1989 | 2788 | 4760 | 2545 | 838 | 538 | 554 | 695 | 767 | 741 | 1503.67 |
| 1950 | 761 | 1169 | 1740 | 2664 | 3378 | 4641 | 2099 | 760 | 651 | 903 | 1113 | 1197 | 1756.33 |
| 1951 | 1112 | 1749 | 1529 | 3018 | 4139 | 2910 | 1294 | 684 | 591 | 937 | 893 | 1018 | 1656.17 |
| 1952 | 904 | 1146 | 1487 | 4219 | 5238 | 3349 | 1337 | 657 | 627 | 626 | 585 | 593 | 1730.67 |
| 1953 | 1144 | 1227 | 1180 | 1810 | 2877 | 4660 | 1720 | 688 | 619 | 640 | 678 | 752 | 1499.58 |
| 1954 | 763 | 1063 | 1123 | 2098 | 3718 | 2930 | 1479 | 688 | 635 | 644 | 710 | 628 | 1373.25 |
| 1955 | 624 | 588 | 660 | 1471 | 2824 | 3641 | 1458 | 610 | 568 | 669 | 837 | 1477 | 1285.58 |
| 1956 | 1257 | 1000 | 1820 | 3539 | 5281 | 4227 | 1198 | 709 | 659 | 775 | 795 | 873 | 1844.42 |
| 1957 | 678 | 1033 | 1887 | 2440 | 5643 | 3613 | 1017 | 619 | 626 | 723 | 667 | 751 | 1641.42 |
| 1958 | 725 | 1445 | 1258 | 2485 | 4570 | 2944 | 855 | 543 | 639 | 666 | 1023 | 1232 | 1532.08 |
| 1959 | 1286 | 1125 | 1190 | 2054 | 2699 | 3434 | 1088 | 614 | 860 | 1328 | 1155 | 925 | 1479.83 |
| 1960 | 816 | 959 | 1436 | 2197 | 2677 | 2902 | 836 | 633 | 614 | 631 | 769 | 730 | 1266.67 |
| 1961 | 782 | 1378 | 1268 | 1513 | 2684 | 2730 | 628 | 460 | 564 | 641 | 626 | 703 | 1164.75 |
| 1962 | 896 | 1019 | 1041 | 2553 | 2935 | 2762 | 957 | 625 | 595 | 984 | 995 | 1113 | 1372.92 |
| 1963 | 878 | 1448 | 1079 | 1419 | 2942 | 3208 | 1081 | 615 | 666 | 640 | 716 | 765 | 1288.08 |
| 1964 | 823 | 768 | 842 | 1765 | 3381 | 4986 | 1513 | 731 | 750 | 709 | 797 | 1799 | 1572 |
| 1965 | 1765 | 2611 | 1962 | 3333 | 4259 | 4344 | 1688 | 904 | 850 | 950 | 856 | 861 | 2031.92 |
| 1966 | 1022 | 847 | 1100 | 1637 | 2133 | 1619 | 669 | 486 | 535 | 606 | 677 | 789 | 1010 |
| 1967 | 1015 | 1016 | 1003 | 1189 | 3061 | 4035 | 1329 | 568 | 583 | 742 | 871 | 880 | 1357.67 |
| 1968 | -9999 | -9999 | -9999 | -9999 | -9999 | -9999 | -9999 | -9999 | -9999 | -9999 | -9999 | -9999 | -9999 |
| 1969 | 1550 | 1380 | 1750 | 3290 | 4010 | 2430 | 941 | 574 | 598 | 697 | 658 | 716 | 1549.5 |
| 1970 | 1350 | 1490 | 1150 | 1300 | 3360 | 4230 | 1440 | 608 | 749 | 779 | 950 | 1090 | 1541.33 |
| 1971 | 1650 | 2250 | 1820 | 3130 | 5400 | 4890 | 1910 | 696 | 704 | 889 | 948 | 944 | 2102.58 |
| 1972 | 1220 | 1670 | 3540 | 2790 | 4100 | 4560 | 1410 | 698 | 689 | 879 | 968 | 1100 | 1968.67 |
| |
|
|
|
|
|
|
|
|
|
|
|
|
|
| Avg | 912.29 | 1051.86 | 1363.32 | 2290.75 | 3549.66 | 3191.82 | 1142.93 | 560.13 | 558.84 | 681.05 | 784.75 | 889.49 | 1415.23 |
| |
|
|
|
|
|
|
|
|
|
|
|
|
|
| Std Dev | 332.37 |
405.87 |
501.58 |
768.19 |
1040.3 |
1242.02 |
507.75 |
120.88 |
113.65 |
162.26 |
191.97 |
312.06 |
322.96 |
| |
|
|
|
|
|
|
|
|
|
|
|
|
|
| | Jan | Feb | Mar | Apr | May | Jun | Jul | Aug | Sep | Oct | Nov | Dec | Avg Annual |
Click here for this table in tab-delimited format.
Tab-delimited format will open in most table browsing software, i.e. Excel, etc.
View this station on the map.
Return to start.