Results
| Country: | U.S.A.
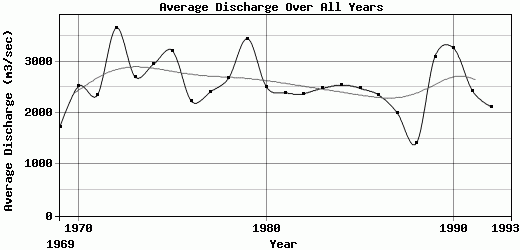
| | Station: | LEWISVILLE ID | | River: | SNAKE RIVER | | Area: | 23567.60 | | Lat: | 43.62 | | Lon: | -112.06 | | Source: | USGS | | PointID: | 13057150 | | Area Units: | km2 | | Discharge Units: | m3/sec | | Starting Year: | 1969 | | Ending Year: | 1993 | | Total Years: | 25 | | Total Usable Years: | 24 | |
| |
| Year | Jan | Feb | Mar | Apr | May | Jun | Jul | Aug | Sep | Oct | Nov | Dec | Avg Annual |
|---|
| 1969 | 2589.36 | 3277.39 | 1516.24 | 3319.41 | 2143.69 | 828.46 | 1581.28 | 1378.03 | 554.54 | 499.48 | 1047.82 | 2068.6 | 1733.69 |
| 1970 | 2644.72 | 4629.83 | 3460.43 | 5254.31 | 2280.98 | 1162.79 | 1028.91 | 849.97 | 769.94 | 1308.79 | 2977.91 | 3846.18 | 2517.9 |
| 1971 | 3136.7 | 5430.8 | 4665.09 | 1821.63 | 3449.74 | 1347.13 | 911.17 | 968.81 | 1624.17 | 887.97 | 977.03 | 2950.81 | 2347.59 |
| 1972 | 4150.08 | 4348.12 | 5895.42 | 6363.68 | 2801.83 | 3079.95 | 2852.89 | 1313.63 | 705.94 | 1216.17 | 3959.75 | 7155.07 | 3653.54 |
| 1973 | 2608.09 | 3905.02 | 4996.49 | 5366.64 | 4357.44 | 2123.68 | 836.63 | 730.03 | 473.27 | 844.03 | 2537.58 | 3619.46 | 2699.86 |
| 1974 | 6873.72 | 2979.86 | 4831.98 | 4252.08 | 3086.46 | 3111.57 | 969.35 | 775.79 | 1692.51 | 814.34 | 1884.59 | 4114.73 | 2948.91 |
| 1975 | 4597.4 | 6133.66 | 7151.41 | 4152.5 | 3700.3 | 2376.46 | 755.06 | 835.99 | 2232.32 | 2116.01 | 1696.09 | 2743.09 | 3207.52 |
| 1976 | 4542.14 | 5021.78 | 3702.58 | 2018.53 | 1036.77 | 1076.52 | 1514.32 | 860.56 | 602.84 | 2834.44 | 1539.88 | 1990.41 | 2228.4 |
| 1977 | 769.4 | 2539.83 | 5120.81 | 4503.35 | 1653.8 | 760.22 | 1327.52 | 1711.99 | 1238.11 | 2098.38 | 2646.41 | 4453.62 | 2401.95 |
| 1978 | 4177.58 | 1875.6 | 5714.55 | 3877.54 | 3948.94 | 1654.56 | 1421.33 | 1220.92 | 677.65 | 852.62 | 1145.61 | 5573.7 | 2678.38 |
| 1979 | 6252.58 | 4183.13 | 6396.45 | 4429.44 | 2984.25 | 2168.99 | 1512.77 | 2001.65 | 2443.95 | 3151.13 | 2799.89 | 2990.91 | 3442.93 |
| 1980 | 3014.57 | 1981.51 | 5134.51 | 5188.9 | 2667.74 | 2210.33 | 1894.59 | 3215.53 | 982.98 | 734.96 | 1371.11 | 1688.24 | 2507.08 |
| 1981 | 1039.78 | 4896.62 | 3167.94 | 3904.82 | 3494.68 | 4927.25 | 1296.37 | 610.84 | 977.03 | 969.08 | 1300.6 | 2067.6 | 2387.72 |
| 1982 | 3056.23 | 5193.54 | 5746.34 | 2658.68 | 1237.45 | 2725.42 | 1185.2 | 678.6 | 619.58 | 578.4 | 1417.17 | 3330.63 | 2368.94 |
| 1983 | 1811.37 | 2968.23 | 3179.45 | 5434.03 | 6074.45 | 1652.2 | 1099.43 | 509.29 | 369 | 732.41 | 1913.95 | 3957.62 | 2475.12 |
| 1984 | 1308.79 | 3886.46 | 4484.23 | 5911.65 | 4404.75 | 1531.19 | 1207.13 | 1170.13 | 527.42 | 647.27 | 2176.07 | 3261.75 | 2543.07 |
| 1985 | 2027.04 | 4105.56 | 4694.96 | 3119.02 | 1898.79 | 1180.44 | 877.19 | 514.36 | 339.88 | 528.24 | 5906.93 | 4521.13 | 2476.13 |
| 1986 | 2234.94 | 6218.31 | 3735.74 | 1491.17 | 1187.4 | 1525.44 | 1798.31 | 538.02 | 620.8 | 1321.31 | 3155.55 | 4340.17 | 2347.26 |
| 1987 | 2298.24 | 2443.86 | 2705 | 6986.75 | 1852.75 | 1092.19 | 1262.92 | 520.86 | 1032.34 | 603.88 | 728.79 | 2351.86 | 1989.95 |
| 1988 | 1800.14 | 3408.59 | 2765.66 | 2136.8 | 1664.4 | 380.64 | 369.78 | 319.16 | 444.66 | 455.78 | 1566.59 | 1533.41 | 1403.8 |
| 1989 | 2838.55 | 4809.24 | 4289.48 | 4433.4 | 6154.84 | 4675.61 | 1751.91 | 1239.65 | 1570.84 | 2177.39 | 2121.6 | 1090.15 | 3096.06 |
| 1990 | 4746.48 | 6945.96 | 2447.32 | 3240.22 | 3513.59 | 2569.86 | 2356.89 | 1094.95 | 1621.34 | 2905.05 | 1813.99 | 5802.88 | 3254.88 |
| 1991 | 6743.65 | 5135.49 | 6363.56 | 3831.39 | 1204.29 | 576.75 | 531.17 | 499.38 | 503.57 | 320.33 | 620.33 | 2744.37 | 2422.86 |
| 1992 | 1881.07 | 2256.96 | 4136.47 | 3462.23 | 1728.52 | 1147.31 | 1759.14 | 1621.83 | 1137.68 | 937.02 | 2356.26 | 2990.64 | 2117.93 |
| 1993 | -9999 | -9999 | -9999 | -9999 | -9999 | -9999 | -9999 | -9999 | -9999 | -9999 | -9999 | -9999 | -9999 |
| |
|
|
|
|
|
|
|
|
|
|
|
|
|
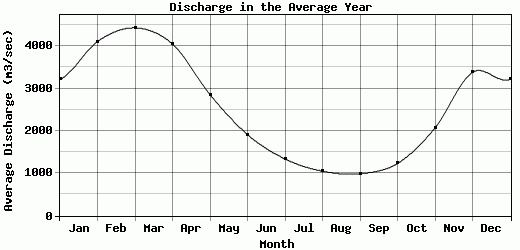
| Avg | 3214.28 | 4107.31 | 4429.25 | 4048.26 | 2855.33 | 1911.87 | 1337.55 | 1049.17 | 990.1 | 1230.6 | 2069.23 | 3382.79 | 2552.14 |
| |
|
|
|
|
|
|
|
|
|
|
|
|
|
| Std Dev | 1676.94 |
1367.49 |
1377 |
1416.04 |
1405.95 |
1145.09 |
549.3 |
619.63 |
578.7 |
825.61 |
1132.38 |
1424.74 |
508.99 |
| |
|
|
|
|
|
|
|
|
|
|
|
|
|
| | Jan | Feb | Mar | Apr | May | Jun | Jul | Aug | Sep | Oct | Nov | Dec | Avg Annual |
Click here for this table in tab-delimited format.
Tab-delimited format will open in most table browsing software, i.e. Excel, etc.
View this station on the map.
Return to start.