Results
| Country: | U.S.A.
| | Station: | OTTAWA, IL | | River: | ILLINOIS RIVER | | Area: | 28356.23 | | Lat: | 41.34 | | Lon: | -88.84 | | Source: | USGS | | PointID: | 5553500 | | Area Units: | km2 | | Discharge Units: | m3/sec | | Starting Year: | 1896 | | Ending Year: | 1910 | | Total Years: | 15 | | Total Usable Years: | 7 | |
| |
| Year | Jan | Feb | Mar | Apr | May | Jun | Jul | Aug | Sep | Oct | Nov | Dec | Avg Annual |
|---|
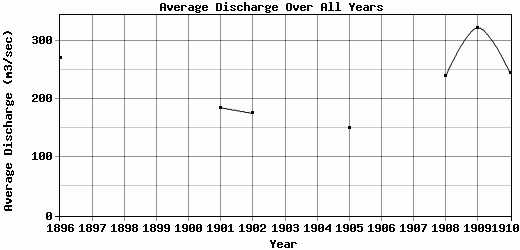
| 1896 | 137.02 | 147.25 | 157.84 | 166.8 | 343.33 | 1094.45 | 483.88 | 161.77 | 139.73 | 140.51 | 136.39 | 135.92 | 270.41 |
| 1897 | -9999 | -9999 | -9999 | -9999 | -9999 | -9999 | -9999 | -9999 | -9999 | -9999 | -9999 | -9999 | -9999 |
| 1898 | -9999 | -9999 | -9999 | -9999 | -9999 | -9999 | -9999 | -9999 | -9999 | -9999 | -9999 | -9999 | -9999 |
| 1899 | -9999 | -9999 | -9999 | -9999 | -9999 | -9999 | -9999 | -9999 | -9999 | -9999 | -9999 | -9999 | -9999 |
| 1900 | -9999 | -9999 | -9999 | -9999 | -9999 | -9999 | -9999 | -9999 | -9999 | -9999 | -9999 | -9999 | -9999 |
| 1901 | 127.43 | 130.26 | 141.58 | 169.9 | 593.43 | 399.71 | 131.71 | 59.95 | 80.62 | 117.17 | 134.17 | 133.29 | 184.94 |
| 1902 | 125.48 | 126.52 | 125.88 | 144.82 | 333.68 | 510.84 | 195.09 | 68.65 | 74.08 | 113.78 | 144.08 | 142.89 | 175.48 |
| 1903 | -9999 | -9999 | -9999 | -9999 | -9999 | -9999 | -9999 | -9999 | -9999 | -9999 | -9999 | -9999 | -9999 |
| 1904 | -9999 | -9999 | -9999 | -9999 | -9999 | -9999 | -9999 | -9999 | -9999 | -9999 | -9999 | -9999 | -9999 |
| 1905 | 164.23 | 157.19 | 159.78 | 163.71 | 252.72 | 308.9 | 128.73 | 55.96 | 55.35 | 96.71 | 126.98 | 128.85 | 149.93 |
| 1906 | -9999 | -9999 | -9999 | -9999 | -9999 | -9999 | -9999 | -9999 | -9999 | -9999 | -9999 | -9999 | -9999 |
| 1907 | -9999 | -9999 | -9999 | -9999 | -9999 | -9999 | -9999 | -9999 | -9999 | -9999 | -9999 | -9999 | -9999 |
| 1908 | 175.59 | 171.62 | 222.07 | 229.37 | 318.93 | 605.04 | 286.97 | 129.23 | 156.33 | 195.5 | 195.44 | 181.78 | 238.99 |
| 1909 | 203.84 | 190.71 | 180.71 | 203.36 | 446.77 | 928.61 | 552.94 | 219.69 | 262.74 | 204.54 | 230.54 | 241.47 | 322.16 |
| 1910 | 288.6 | 284.44 | 311.8 | 455.53 | 591.46 | 296.76 | 124.41 | 62.81 | 89.5 | 110.38 | 162.18 | 164.4 | 245.19 |
| |
|
|
|
|
|
|
|
|
|
|
|
|
|
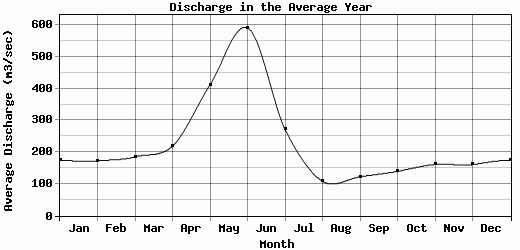
| Avg | 174.6 | 172.57 | 185.67 | 219.07 | 411.47 | 592.04 | 271.96 | 108.29 | 122.62 | 139.8 | 161.4 | 161.23 | 226.73 |
| |
|
|
|
|
|
|
|
|
|
|
|
|
|
| Std Dev | 53.46 |
50.19 |
58.82 |
100 |
126.05 |
287.06 |
165.59 |
59.07 |
66.34 |
40.01 |
35.44 |
37.18 |
55.78 |
| |
|
|
|
|
|
|
|
|
|
|
|
|
|
| | Jan | Feb | Mar | Apr | May | Jun | Jul | Aug | Sep | Oct | Nov | Dec | Avg Annual |
Click here for this table in tab-delimited format.
Tab-delimited format will open in most table browsing software, i.e. Excel, etc.
View this station on the map.
Return to start.