Results
| Country: | Romania
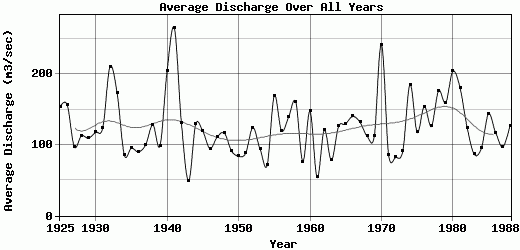
| | Station: | SatuMare | | River: | Somes | | Area: | 15155 km2 | | Lat: | 47.78 | | Lon: | 22.88 | | Source: | RivDIS | | PointID: | 214 | | Area Units: | km2 | | Discharge Units: | m3/sec | | Starting Year: | 1925 | | Ending Year: | 1988 | | Total Years: | 64 | | Total Usable Years: | 64 | |
| |
| Year | Jan | Feb | Mar | Apr | May | Jun | Jul | Aug | Sep | Oct | Nov | Dec | Avg Annual |
|---|
| 1925 | 32.5 | 71.2 | 119 | 89 | 103 | 62.7 | 265 | 159 | 214 | 116 | 191 | 422 | 153.7 |
| 1926 | 250 | 218 | 114 | 223 | 175 | 213 | 110 | 208 | 77 | 115 | 87.5 | 94 | 157.04 |
| 1927 | 127 | 54.3 | 151 | 134 | 132 | 86.8 | 58 | 62.3 | 81 | 80 | 128 | 74.5 | 97.41 |
| 1928 | 73 | 85 | 211 | 243 | 139 | 212 | 58.2 | 31.7 | 41.1 | 90.5 | 85.6 | 83 | 112.76 |
| 1929 | 113 | 58.4 | 98 | 214 | 177 | 152 | 173 | 103 | 60.2 | 40.3 | 66.8 | 60.2 | 109.66 |
| 1930 | 52 | 103 | 121 | 189 | 184 | 129 | 41 | 52 | 33 | 74 | 314 | 121 | 117.75 |
| 1931 | 118 | 89.8 | 207 | 127 | 121 | 72.3 | 56.3 | 53.3 | 104 | 185 | 241 | 119 | 124.47 |
| 1932 | 555 | 180 | 402 | 700 | 210 | 112 | 61.2 | 52.4 | 27.7 | 42.2 | 101 | 81 | 210.37 |
| 1933 | 32.3 | 58.9 | 261 | 172 | 347 | 292 | 315 | 108 | 134 | 108 | 135 | 114 | 173.1 |
| 1934 | 85.5 | 66.2 | 280 | 79.1 | 35.4 | 57.3 | 112 | 54.7 | 69.8 | 61.3 | 57.2 | 72.7 | 85.93 |
| 1935 | 29.6 | 91 | 250 | 240 | 260 | 112 | 26.5 | 18.8 | 24.9 | 19.4 | 26.2 | 46.1 | 95.38 |
| 1936 | 90 | 119 | 89 | 199 | 52.5 | 42.4 | 52.1 | 63.8 | 61.6 | 168 | 100 | 45 | 90.2 |
| 1937 | 48.1 | 172 | 314 | 134 | 91.5 | 46.4 | 80.2 | 72 | 47 | 35.6 | 50.9 | 111 | 100.23 |
| 1938 | 85 | 68.4 | 176 | 234 | 304 | 142 | 103 | 155 | 97.9 | 40.1 | 74 | 60.5 | 128.33 |
| 1939 | 142 | 70.8 | 110 | 142 | 136 | 88.9 | 44.5 | 38.4 | 21 | 106 | 147 | 137 | 98.63 |
| 1940 | 31.3 | 268 | 756 | 282 | 217 | 366 | 149 | 65.1 | 55.4 | 87.6 | 129 | 49.7 | 204.68 |
| 1941 | 256 | 375 | 264 | 619 | 340 | 159 | 96.5 | 68.5 | 338 | 366 | 205 | 97.5 | 265.38 |
| 1942 | 52.1 | 154 | 346 | 321 | 412 | 132 | 42.5 | 25.2 | 14.7 | 19.8 | 30.4 | 19.4 | 130.76 |
| 1943 | 12.9 | 40.9 | 49.6 | 134 | 85.5 | 74.4 | 83 | 22.1 | 15.5 | 12.5 | 14.1 | 45.3 | 49.15 |
| 1944 | 31.3 | 155 | 122 | 371 | 143 | 80.4 | 87.3 | 57.8 | 23.8 | 92 | 191 | 195 | 129.13 |
| 1945 | 43 | 29 | 254 | 211 | 250 | 120 | 97.3 | 210 | 50.3 | 58.3 | 39 | 66.6 | 119.04 |
| 1946 | 56.5 | 186 | 317 | 193 | 126 | 55.9 | 28.3 | 14.1 | 10.6 | 12.1 | 81.8 | 55.5 | 94.73 |
| 1947 | 14.6 | 203 | 318 | 118 | 44.3 | 38.5 | 48.6 | 46.9 | 62.7 | 24.2 | 197 | 216 | 110.98 |
| 1948 | 538 | 142 | 90.5 | 118 | 51.7 | 157 | 137 | 45 | 27.9 | 19.2 | 47.7 | 27.9 | 116.83 |
| 1949 | 39.5 | 97.8 | 157 | 105 | 72.9 | 172 | 224 | 56.7 | 21.9 | 18.6 | 52.9 | 82.4 | 91.73 |
| 1950 | 38.8 | 183 | 160 | 132 | 65 | 27.1 | 22.1 | 30.9 | 14.8 | 34.3 | 110 | 192 | 84.17 |
| 1951 | 60.3 | 95.6 | 194 | 200 | 162 | 122 | 56.9 | 61.4 | 33.3 | 23.9 | 22.1 | 28 | 88.29 |
| 1952 | 39.5 | 174 | 151 | 405 | 141 | 91.8 | 25.6 | 19 | 26.9 | 76.3 | 106 | 238 | 124.51 |
| 1953 | 185 | 170 | 134 | 159 | 116 | 138 | 89.3 | 43.3 | 38.9 | 22.3 | 18 | 17.2 | 94.25 |
| 1954 | 10.1 | 9.7 | 107 | 87 | 180 | 212 | 68.4 | 43.1 | 21.3 | 41 | 24.2 | 47.8 | 70.97 |
| 1955 | 268 | 233 | 253 | 247 | 201 | 147 | 175 | 189 | 55.9 | 36 | 44.7 | 181 | 169.22 |
| 1956 | 148 | 63.8 | 184 | 340 | 195 | 107 | 148 | 46.9 | 24.1 | 19.9 | 35.5 | 127 | 119.93 |
| 1957 | 41.2 | 288 | 236 | 178 | 283 | 199 | 101 | 57.3 | 59.3 | 87.5 | 38 | 99.8 | 139.01 |
| 1958 | 67.2 | 459 | 283 | 422 | 298 | 83.8 | 120 | 32.7 | 25 | 29.8 | 31.8 | 80.4 | 161.06 |
| 1959 | 113 | 39.4 | 135 | 109 | 59 | 92.2 | 67.5 | 109 | 35.1 | 30.4 | 37.4 | 88.7 | 76.31 |
| 1960 | 128 | 277 | 134 | 225 | 122 | 106 | 126 | 103 | 38 | 75 | 244 | 194 | 147.67 |
| 1961 | 68.4 | 69.2 | 134 | 109 | 73.6 | 74.4 | 29.7 | 26.4 | 12.4 | 12.3 | 15 | 22.2 | 53.88 |
| 1962 | 67 | 81.8 | 298 | 524 | 149 | 73.6 | 132 | 45.4 | 22.1 | 16 | 24.5 | 17 | 120.87 |
| 1963 | 89.8 | 112 | 202 | 189 | 88.2 | 67.7 | 36.2 | 32.4 | 19.9 | 22.9 | 36.3 | 40.9 | 78.11 |
| 1964 | 26.5 | 22.2 | 285 | 442 | 142 | 44.6 | 54.6 | 76 | 60.9 | 75 | 87.2 | 196 | 126 |
| 1965 | 87 | 172 | 297 | 143 | 157 | 332 | 87 | 38 | 30 | 17 | 55 | 140 | 129.58 |
| 1966 | 56 | 423 | 106 | 200 | 105 | 205 | 154 | 19 | 104 | 51 | 136 | 124 | 140.25 |
| 1967 | 62 | 123 | 558 | 327 | 175 | 102 | 54 | 28 | 22 | 21 | 21 | 92 | 132.08 |
| 1968 | 61 | 363 | 184 | 241 | 102 | 37 | 24 | 70 | 99 | 78 | 45 | 41 | 112.08 |
| 1969 | 28 | 132 | 193 | 169 | 114 | 173 | 168 | 73 | 47 | 27 | 69.4 | 151 | 112.03 |
| 1970 | 177 | 319 | 414 | 365 | 724 | 447 | 135 | 58 | 50 | 44 | 84 | 83 | 241.67 |
| 1971 | 185 | 80 | 98 | 116 | 126 | 110 | 143 | 34 | 26 | 20 | 38 | 59 | 86.25 |
| 1972 | 25 | 47 | 49 | 104 | 88 | 36 | 46 | 64 | 88 | 120 | 229 | 90 | 82.17 |
| 1973 | 37 | 113 | 118 | 99.5 | 105 | 228 | 156 | 69 | 29 | 41 | 38 | 65 | 91.54 |
| 1974 | 47.5 | 143 | 101 | 53.6 | 138 | 577 | 355 | 109 | 67.3 | 173 | 253 | 207 | 185.37 |
| 1975 | 151 | 53.5 | 112 | 320 | 117 | 206 | 162 | 71 | 73 | 61.5 | 42.5 | 45 | 117.88 |
| 1976 | 62 | 77 | 265 | 349 | 142 | 114 | 43.5 | 50.5 | 49 | 605 | 47 | 47 | 154.25 |
| 1977 | 101 | 294 | 210 | 299 | 132 | 74.5 | 75.5 | 70.5 | 52.5 | 36 | 113 | 59 | 126.42 |
| 1978 | 42 | 211 | 305 | 174 | 403 | 143 | 215 | 63.5 | 187 | 129 | 45.5 | 201 | 176.58 |
| 1979 | 377 | 371 | 234 | 245 | 128 | 74.5 | 119 | 135 | 58 | 37.5 | 42.5 | 91 | 159.38 |
| 1980 | 34.3 | 115 | 142 | 320 | 263 | 318 | 374 | 197 | 75.2 | 151 | 284 | 173 | 203.88 |
| 1981 | 90.6 | 134 | 538 | 146 | 258 | 107 | 98.7 | 87.7 | 60.6 | 118 | 165 | 368 | 180.97 |
| 1982 | 194 | 62.7 | 224 | 237 | 216 | 145 | 164 | 78.4 | 42.9 | 39.1 | 34.6 | 56 | 124.48 |
| 1983 | 67.1 | 157 | 145 | 222 | 158 | 77.1 | 75.4 | 49.4 | 28.7 | 24.9 | 18.5 | 19.2 | 86.86 |
| 1984 | 20.6 | 32.4 | 37.9 | 93.7 | 224 | 251 | 169 | 47 | 55.8 | 79.8 | 59.9 | 74.4 | 95.46 |
| 1985 | 90.6 | 57.1 | 377 | 260 | 332 | 209 | 128 | 52.3 | 30.8 | 25.8 | 58.1 | 108 | 144.06 |
| 1986 | 205 | 151 | 286 | 388 | 115 | 55.6 | 64.3 | 49 | 28.4 | 24.1 | 21.2 | 15.3 | 116.91 |
| 1987 | 49.1 | 173 | 93 | 279 | 153 | 180 | 43 | 42.6 | 25.4 | 22 | 36.8 | 64.5 | 96.78 |
| 1988 | 68.7 | 137 | 343 | 363 | 143 | 155 | 83.8 | 34 | 51.8 | 28.7 | 22.5 | 93.2 | 126.98 |
| |
|
|
|
|
|
|
|
|
|
|
|
|
|
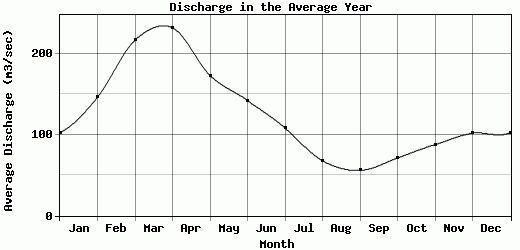
| Avg | 102.77 | 146.49 | 217.14 | 232.39 | 173.48 | 142.48 | 108.42 | 67.96 | 56 | 71.39 | 87.93 | 102.08 | 125.71 |
| |
|
|
|
|
|
|
|
|
|
|
|
|
|
| Std Dev | 106.59 |
102.15 |
128.21 |
128 |
110.08 |
100.37 |
75.48 |
45.6 |
51.54 |
88.42 |
73.98 |
77.1 |
41.88 |
| |
|
|
|
|
|
|
|
|
|
|
|
|
|
| | Jan | Feb | Mar | Apr | May | Jun | Jul | Aug | Sep | Oct | Nov | Dec | Avg Annual |
Click here for this table in tab-delimited format.
Tab-delimited format will open in most table browsing software, i.e. Excel, etc.
View this station on the map.
Return to start.