Results
| Country: | Kenya
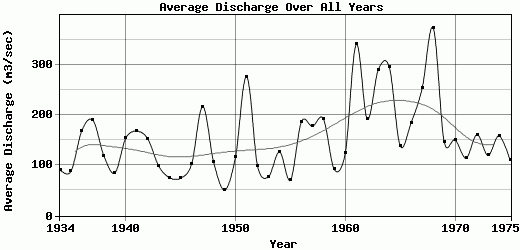
| | Station: | Garissa | | River: | Tana | | Area: | 42217 km2 | | Lat: | -0.45 | | Lon: | 39.7 | | Source: | RivDIS | | PointID: | 56 | | Area Units: | km2 | | Discharge Units: | m3/sec | | Starting Year: | 1934 | | Ending Year: | 1975 | | Total Years: | 42 | | Total Usable Years: | 42 | |
| |
| Year | Jan | Feb | Mar | Apr | May | Jun | Jul | Aug | Sep | Oct | Nov | Dec | Avg Annual |
|---|
| 1934 | 71.5 | 42.5 | 31.5 | 43 | 284 | 122 | 61 | 92 | 67.5 | 61.5 | 104 | 121 | 91.79 |
| 1935 | 59.5 | 51.5 | 58.5 | 80.5 | 137 | 95 | 79.5 | 59.5 | 55 | 72 | 141 | 170 | 88.25 |
| 1936 | 88.5 | 87 | 180 | 397 | 513 | 210 | 124 | 73 | 65 | 72.5 | 126 | 101 | 169.75 |
| 1937 | 59 | 39 | 35 | 389 | 611 | 316 | 131 | 77.5 | 51 | 82.5 | 192 | 299 | 190.17 |
| 1938 | 132 | 87 | 68 | 110 | 165 | 112 | 76 | 68.5 | 62 | 60.5 | 193 | 297 | 119.25 |
| 1939 | 152 | 80.5 | 60.5 | 152 | 98 | 76.5 | 63 | 66.5 | 59 | 49.5 | 106 | 58.5 | 85.17 |
| 1940 | 51.5 | 45 | 164 | 283 | 581 | 163 | 116 | 81 | 56 | 57 | 162 | 94 | 154.46 |
| 1941 | 52.5 | 42 | 93.5 | 414 | 565 | 268 | 149 | 85.5 | 59.5 | 50.5 | 21.5 | 219 | 168.33 |
| 1942 | 90 | 54.5 | 89 | 180 | 545 | 319 | 146 | 100 | 68.5 | 53 | 105 | 87 | 153.08 |
| 1943 | 49.5 | 37.5 | 39.5 | 103 | 321 | 125 | 83.5 | 63.5 | 56.5 | 48 | 76.5 | 181 | 98.71 |
| 1944 | 56.5 | 31.5 | 22.5 | 71 | 97.5 | 43.5 | 37.5 | 37 | 38.5 | 71 | 167 | 235 | 75.71 |
| 1945 | 52.5 | 36 | 25.5 | 34 | 99.5 | 120 | 63.5 | 74 | 81 | 54.5 | 157 | 101 | 74.88 |
| 1946 | 42.5 | 16 | 13 | 61 | 172 | 83.5 | 44 | 56.5 | 76 | 122 | 412 | 139 | 103.13 |
| 1947 | 79 | 49.5 | 85 | 389 | 939 | 404 | 138 | 89.5 | 71.5 | 66.5 | 125 | 174 | 217.5 |
| 1948 | 69.5 | 31 | 39 | 92 | 226 | 121 | 80 | 68 | 52.5 | 54.5 | 205 | 242 | 106.71 |
| 1949 | 86.5 | 43.5 | 28.5 | 86.5 | 71.5 | 55 | 35.5 | 37.5 | 33 | 30.5 | 46 | 57.5 | 50.96 |
| 1950 | 43.5 | 28 | 57 | 314 | 313 | 176 | 85.5 | 81.5 | 93 | 56 | 84.5 | 80.5 | 117.71 |
| 1951 | 39.5 | 26.5 | 29 | 945 | 444 | 344 | 114 | 87 | 63.5 | 82 | 549 | 602 | 277.13 |
| 1952 | 206 | 87.5 | 46.5 | 62 | 267 | 112 | 61.5 | 53 | 48 | 56.5 | 100 | 91 | 99.25 |
| 1953 | 48 | 28 | 28 | 38.5 | 170 | 78 | 47.5 | 42 | 38 | 66 | 197 | 149 | 77.5 |
| 1954 | 68.5 | 42.5 | 31 | 117 | 445 | 267 | 108 | 82 | 58.5 | 50.5 | 101 | 156 | 127.25 |
| 1955 | 60.5 | 48 | 33 | 70 | 132 | 87.5 | 50 | 56.5 | 50 | 69 | 99 | 97.5 | 71.08 |
| 1956 | 166 | 120 | 80 | 230 | 621 | 231 | 133 | 70.5 | 79 | 68 | 279 | 168 | 187.13 |
| 1957 | 93.5 | 68 | 63.5 | 156 | 579 | 250 | 142 | 102 | 80 | 83 | 260 | 264 | 178.42 |
| 1958 | 135 | 130 | 103 | 147 | 695 | 305 | 207 | 123 | 107 | 96 | 105 | 162 | 192.92 |
| 1959 | 95.5 | 99.5 | 57.5 | 93 | 25.5 | 163 | 88 | 79 | 84.5 | 65 | 112 | 141 | 91.96 |
| 1960 | 69.5 | 57.5 | 105 | 206 | 226 | 114 | 76.5 | 61 | 57 | 142 | 267 | 125 | 125.54 |
| 1961 | 66 | 52 | 44 | 173 | 270 | 101 | 85 | 106 | 129 | 567 | 1863 | 643 | 341.58 |
| 1962 | 396 | 182 | 134 | 213 | 423 | 223 | 135 | 104 | 104 | 121 | 137 | 134 | 192.17 |
| 1963 | 118 | 84.5 | 88 | 412 | 870 | 464 | 214 | 159 | 113 | 97.5 | 316 | 552 | 290.67 |
| 1964 | 346 | 186 | 177 | 615 | 542 | 296 | 187 | 188 | 146 | 234 | 190 | 450 | 296.42 |
| 1965 | 200 | 104 | 72 | 130 | 253 | 129 | 81 | 68 | 49 | 69 | 328 | 188 | 139.25 |
| 1966 | 105 | 78 | 112 | 425 | 431 | 194 | 114 | 67 | 67 | 66 | 432 | 137 | 185.67 |
| 1967 | 73 | 47 | 43 | 172 | 695 | 340 | 188 | 145 | 132 | 202 | 596 | 413 | 253.83 |
| 1968 | 182 | 111 | 409 | 715 | 662 | 418 | 233 | 168 | 106 | 118 | 530 | 842 | 374.5 |
| 1969 | 241 | 151 | 210 | 177 | 305 | 141 | 85.5 | 65 | 55 | 63 | 148 | 127 | 147.38 |
| 1970 | 73 | 66.5 | 57.5 | 414 | 364 | 230 | 137 | 103 | 93.5 | 57 | 128 | 89 | 151.04 |
| 1971 | 59 | 31 | 17.5 | 186 | 372 | 196 | 126 | 103 | 83 | 29 | 61 | 115 | 114.88 |
| 1972 | 74.5 | 75 | 49.5 | 47 | 173 | 199 | 102 | 62 | 52 | 167 | 669 | 270 | 161.67 |
| 1973 | 197 | 103 | 58.5 | 140 | 181 | 169 | 88.5 | 73.5 | 60.5 | 82 | 190 | 98.5 | 120.13 |
| 1974 | 56 | 51 | 50 | 346 | 247 | 150 | 250 | 158 | 119 | 125 | 244 | 116 | 159.33 |
| 1975 | 79.5 | 57.5 | 46 | 177 | 181 | 139 | 124 | 102 | 82 | 90 | 166 | 91 | 111.25 |
| |
|
|
|
|
|
|
|
|
|
|
|
|
|
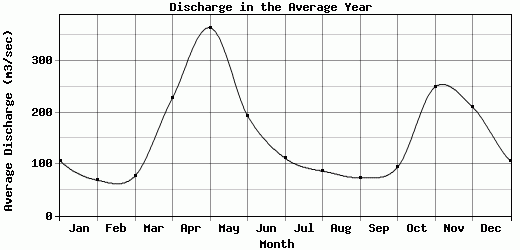
| Avg | 106.76 | 68.79 | 77.01 | 228.7 | 364.57 | 194.05 | 111.68 | 86.63 | 73.86 | 93.51 | 249.77 | 211.37 | 155.56 |
| |
|
|
|
|
|
|
|
|
|
|
|
|
|
| Std Dev | 77.77 |
40.05 |
69.3 |
193.01 |
223.31 |
103.36 |
52.28 |
34.33 |
26.63 |
84.86 |
293.73 |
171.76 |
74.25 |
| |
|
|
|
|
|
|
|
|
|
|
|
|
|
| | Jan | Feb | Mar | Apr | May | Jun | Jul | Aug | Sep | Oct | Nov | Dec | Avg Annual |
Click here for this table in tab-delimited format.
Tab-delimited format will open in most table browsing software, i.e. Excel, etc.
View this station on the map.
Return to start.